If your Unity build feels “mostly fine,” you might still be one spike away from a milestone slip.
Here’s the launch risk scorecard I use to translate profiling chaos into exec-ready release confidence:
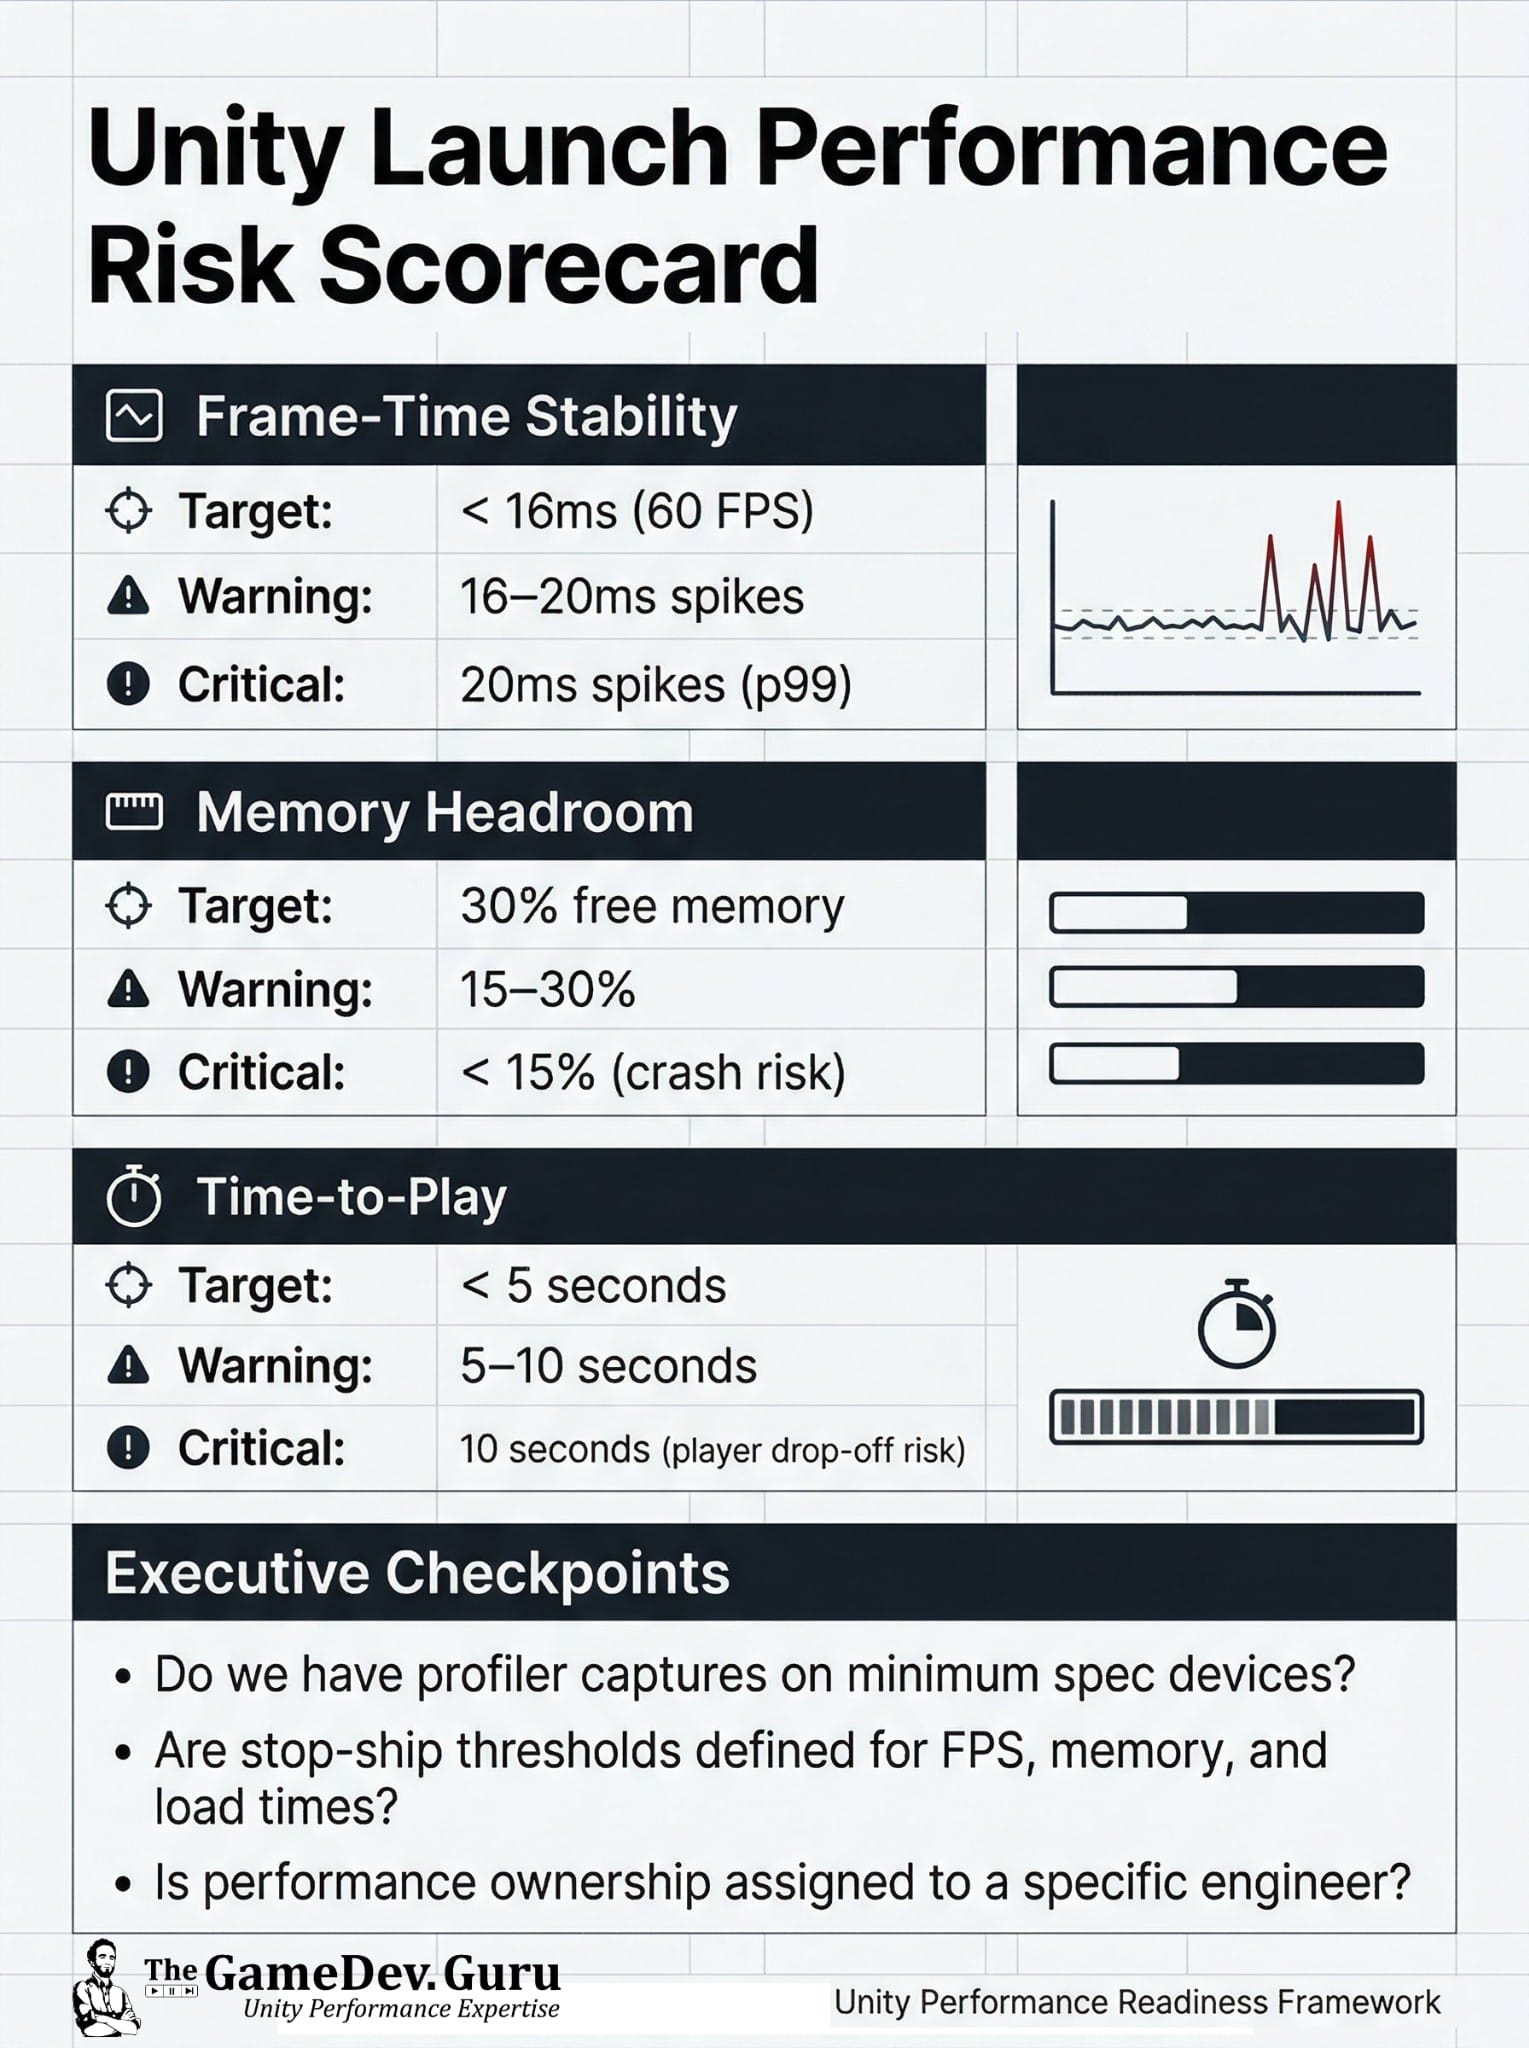
1) Frame-time stability
- Target: < 16ms (60 FPS)
- Warning: 16–20ms spikes
- Critical: 20ms spikes at p99 (you’ll feel it, QA will find it, reviews will punish it)
2) Memory headroom
- Target: 30% free memory
- Warning: 15–30%
- Critical: < 15% (crash risk + platform drama)
3) Time-to-play
- Target: < 5 seconds
- Warning: 5–10 seconds
- Critical: 10+ seconds (player drop-off risk)
Most teams average FPS and call it “stable.” Launch gates care about worst-case behavior: p99 spikes, low-memory edge cases, and cold-start load time.
The diagnostic move (what to ask for this week):
- 60 seconds of gameplay capture on minimum spec devices
- p95/p99 frame-time, plus a note of the worst spike moments
- A cold boot “time-to-play” measurement
For your dev team:
- Capture Unity Profiler on min spec + run Profile Analyzer for p95/p99 spikes
- Check Memory Profiler for headroom (don’t ship near <15%)
- Flag loading/IO stalls (e.g. Addressables + disk) as first-class bugs
This turns “randomly slow” into a ranked risk register... so you protect the date and stop burning senior engineer weeks on guessing.
If this is blocking a milestone, book a Unity Performance Diagnosis Call.
You leave with top root causes + a prioritized execution plan. NDA ok. One capture + context is enough.
https://thegamedev.guru/unity-consulting/
Ruben (TheGameDev.Guru)