
Your first 10 seconds are where players decide whether to stay or bounce. If your build launches, stares back at the player, and does nothing, you are leaking retention before gameplay even starts.
Loading time is not when the splash screen disappears. Count from app tap to the first moment the player can actually interact, usually the main menu. If you stop earlier, you are lying to yourself.
In the Android example from this module, that path lands at about 11 seconds on a strong phone, with roughly 8 seconds spent in the real loading work. That is the proof frame: measure the whole trip, not just the pretty part.
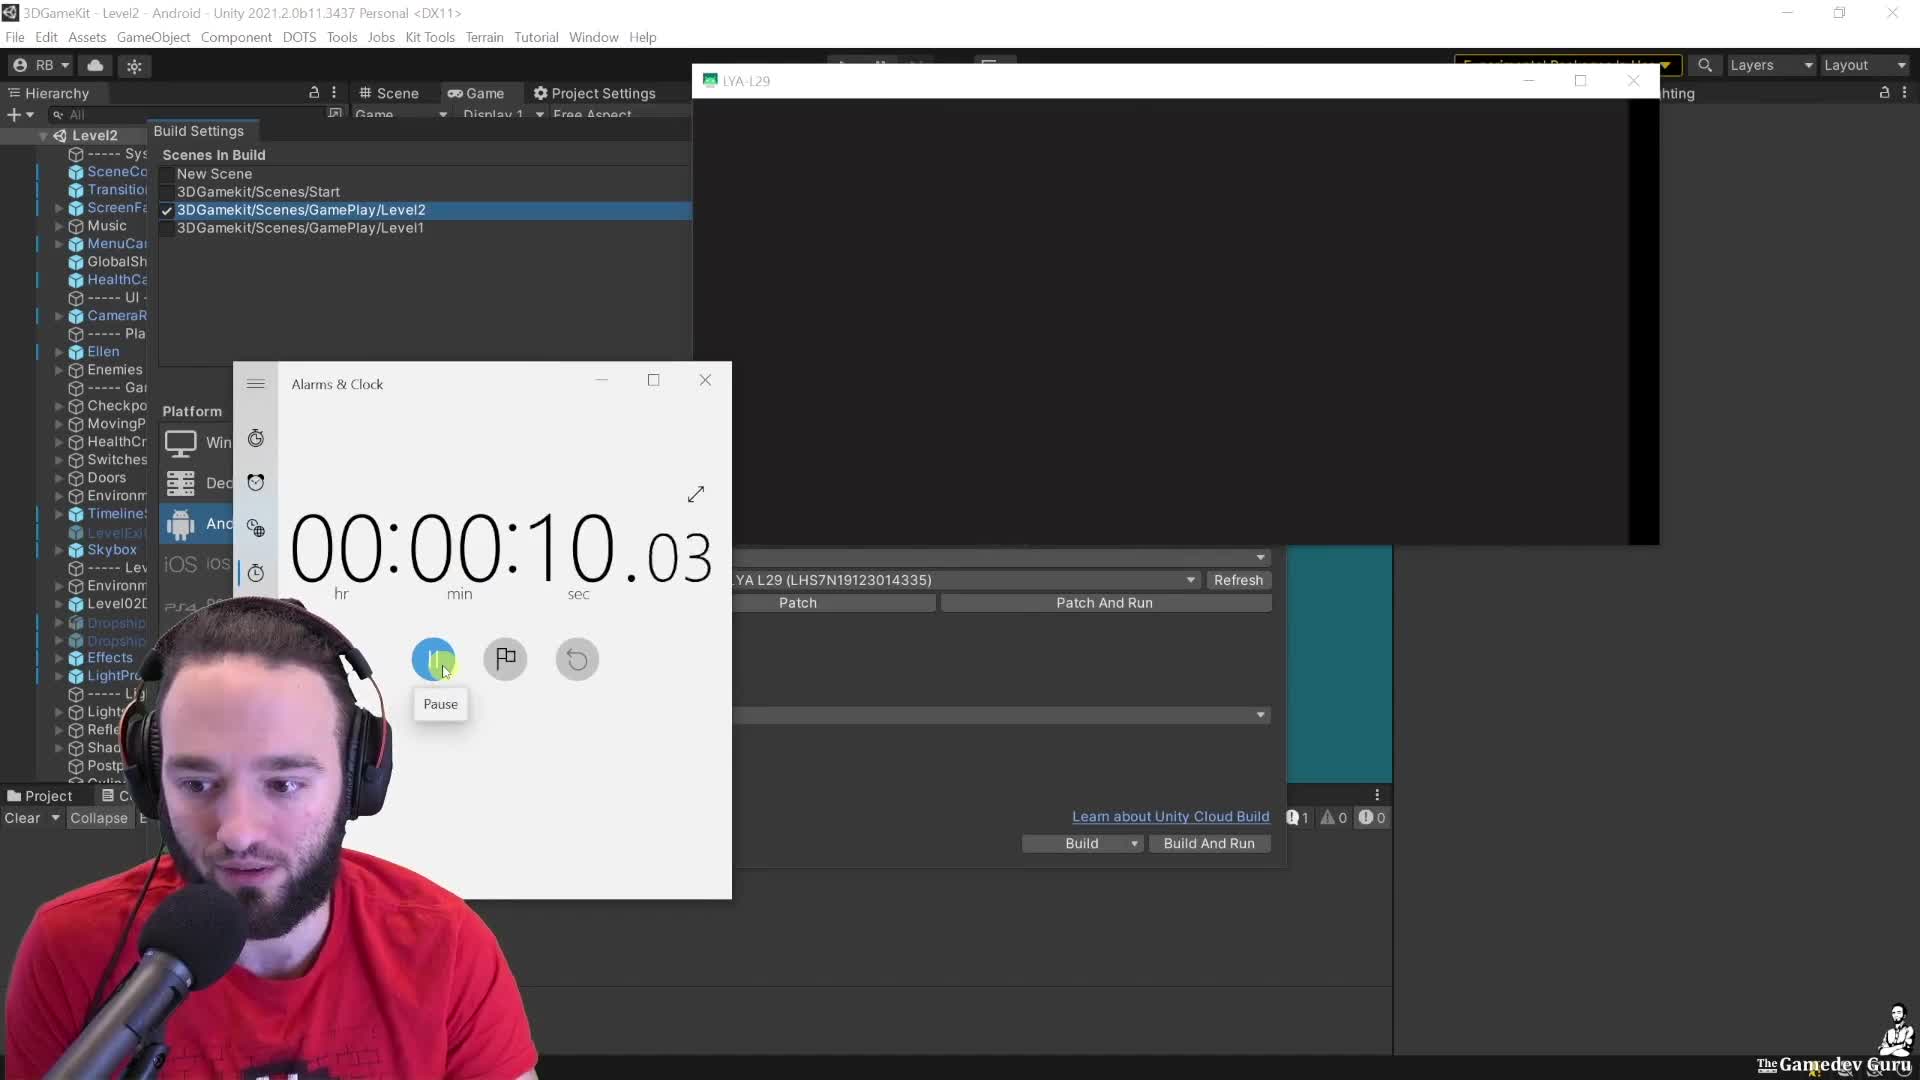
Start here: create an empty startup scene, keep only one camera with a loud clear color, wait 10 seconds, attach the Profiler, then start a stopwatch and load the first real scene. That gives you clean capture data from the real beginning instead of missing the expensive first seconds.
Check this first: open the loading data and look for the big blocks, not the cute 20 ms distractions. In the 3D Game Kit example, the main offender is audio: long clips set to Decompress On Load burn time during startup.
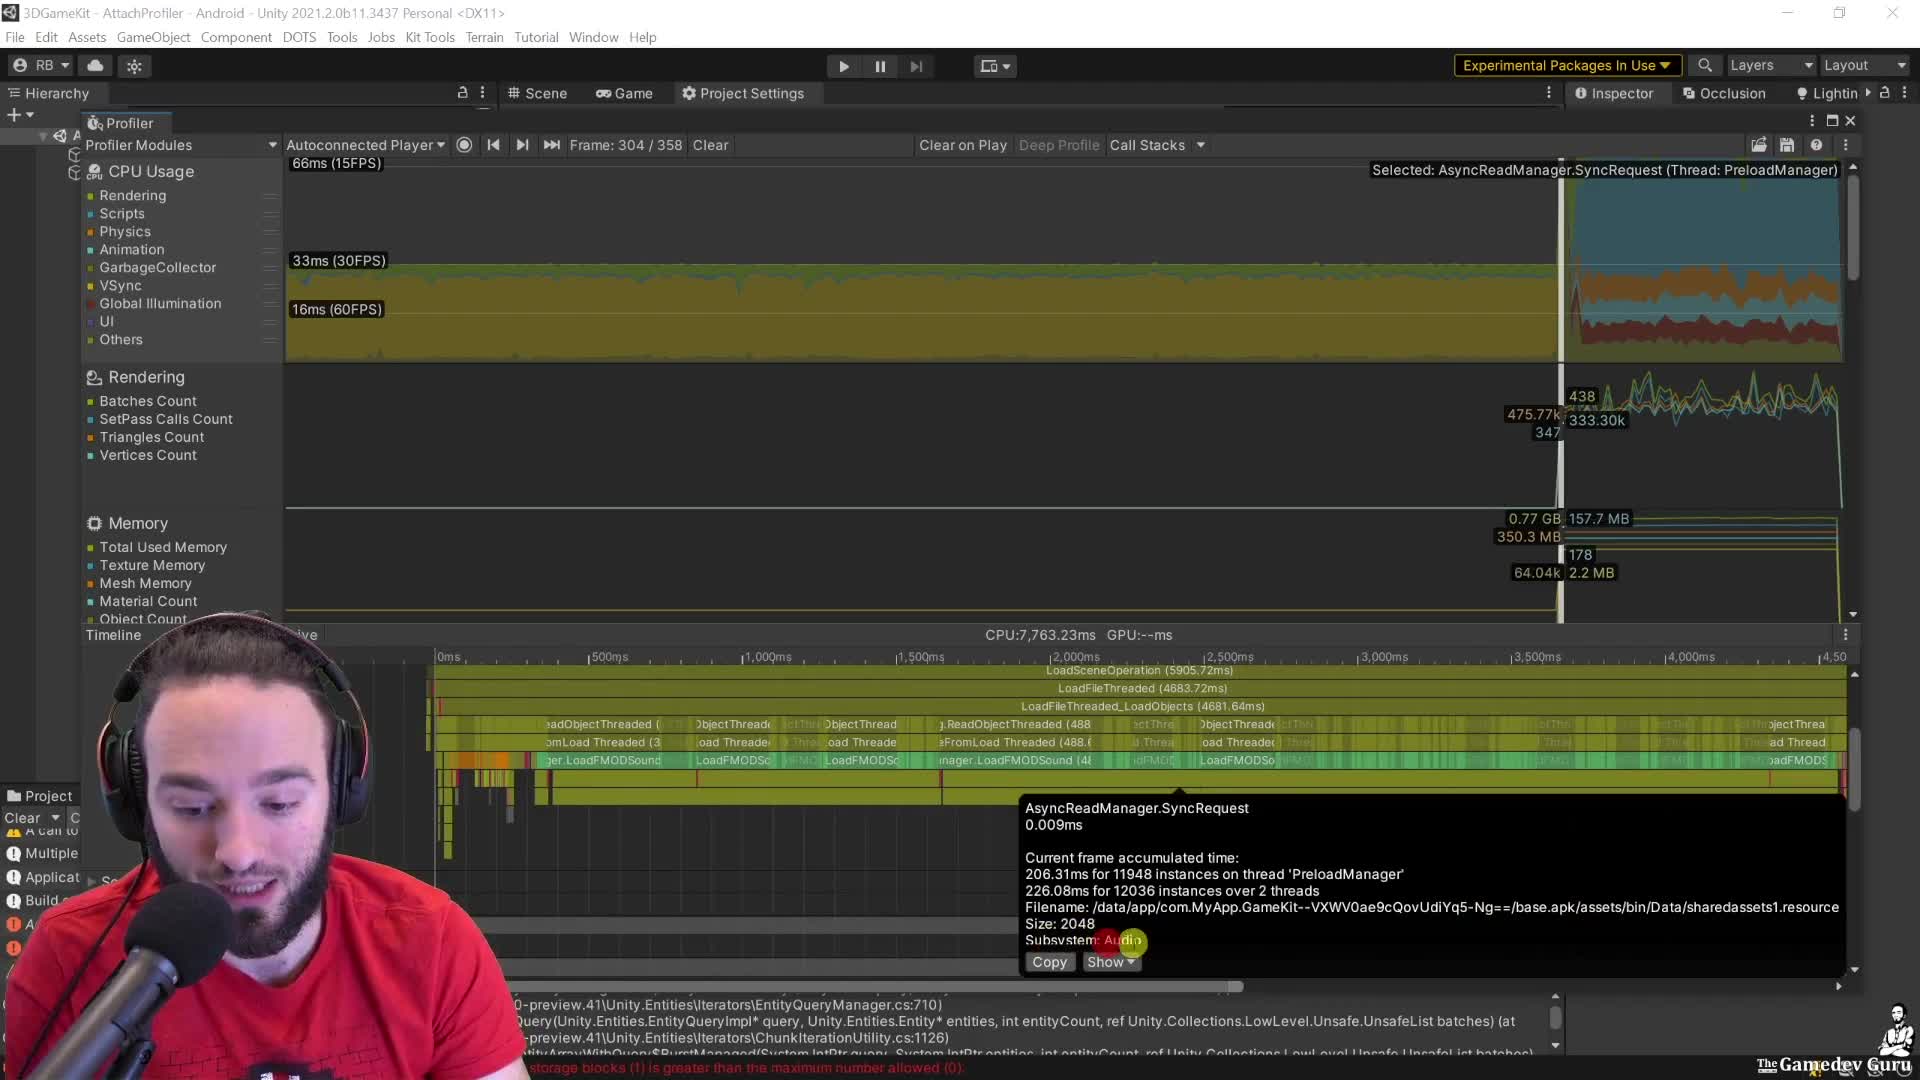
One practical fix from the lesson is to move long music or ambient clips to Streaming. In the example, that trims about 1.5 seconds in one pass. Do not treat that as magic, though: streaming can move cost to runtime CPU and I/O, so you still have to validate the trade.
CEO/Producer translation: if startup already feels slow on a good device, the retention leak on weaker hardware will be worse. The members-only module is the full step-by-step playbook: profiling from app launch, reading loading-thread evidence, isolating audio and scene costs, and deciding which fixes are worth production time.
In this module:
Join to unlock the full module, audio, and resources.