If you cannot explain performance with numbers, you are not optimizing. You are guessing. And guessing is how red metrics sit in the build for months while everyone argues opinions.
This module gives you a system you can actually run: green / orange / red budgets for the metrics that matter on your target, from CPU milliseconds and draw calls to iteration waste like Time Staring at the Screen. Different device? Different scene? Different budget. That is the point.
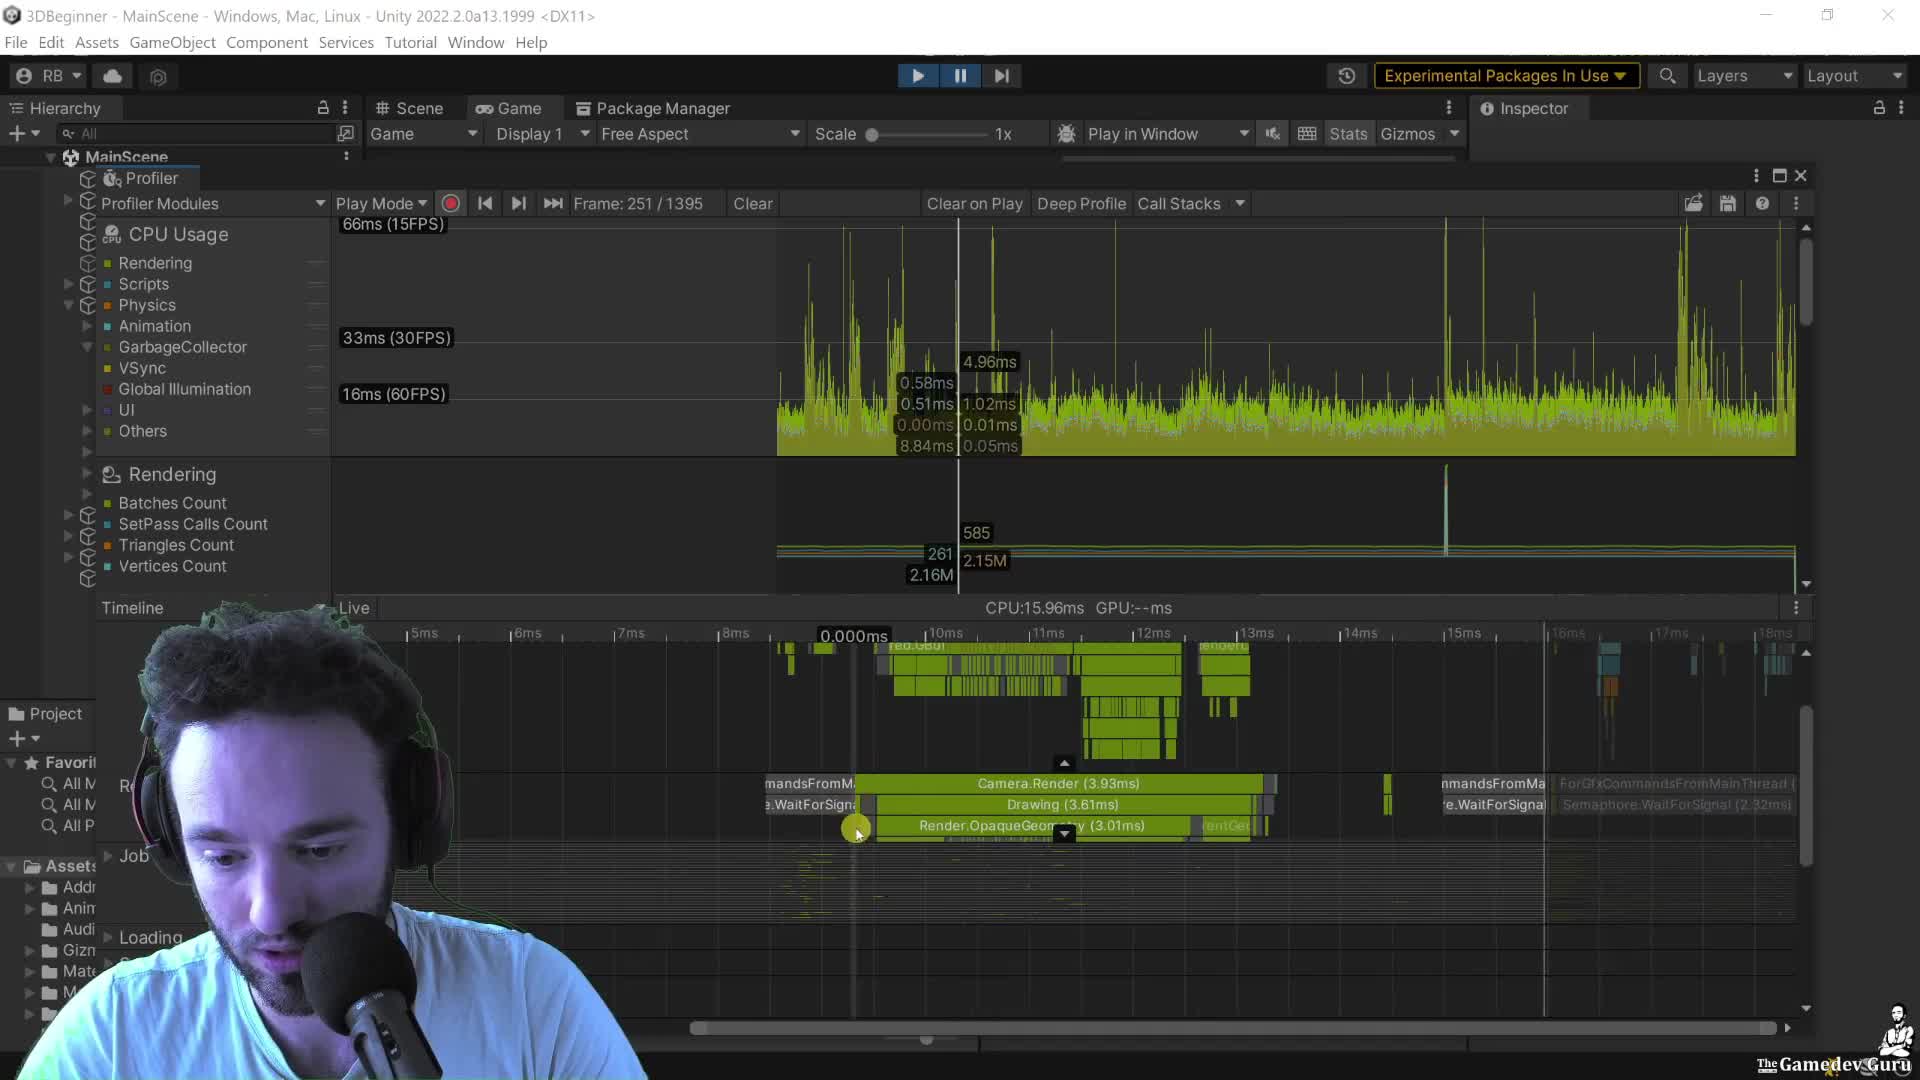
Start here: open the Profiler Timeline and measure the Main Thread correctly. If you profile in the Editor, count the real player-loop work, strip editor-only noise, and then check whether the real problem is actually the Render Thread blocking you. Do not stop at one number and call it a diagnosis.
Then do one blunt sanity check with the tools Unity already gives you: Stats for live counters, Frame Debugger for draw-call proof, and the Profiler thread selector when the main thread is waiting on something else. If you do not know which thread is slow, you do not know what to fix.
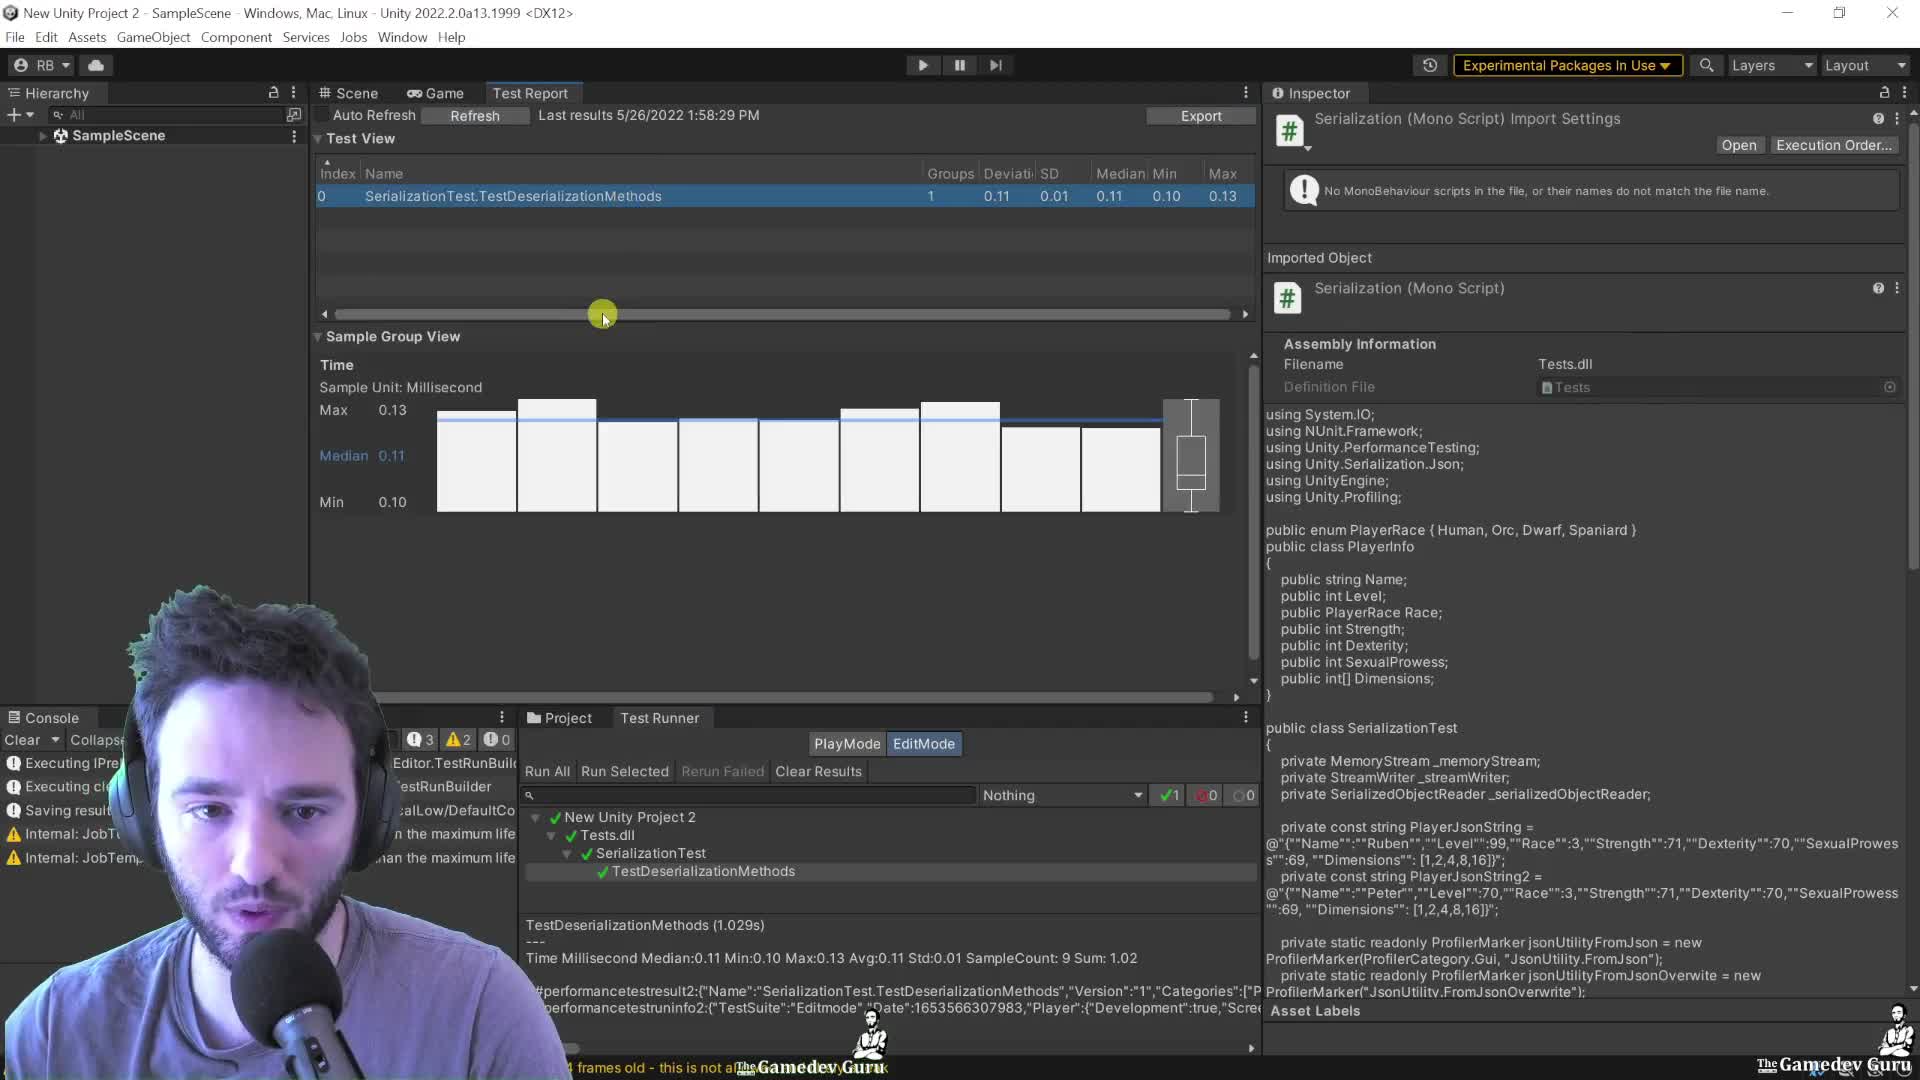
This is where it gets useful: once you have a marker on the bottleneck, stop rerunning the same experiment by hand. Use ProfilerMarker and recorder APIs for targeted metrics, then run the Performance Testing package so you get median, quartiles, standard deviation, and GC data instead of one cherry-picked run.
CEO/Producer translation: this is how you turn performance from vague stress into an accountable review loop. The members-only module is the full step-by-step playbook: metric selection across the Taskforce pillars, specialized profilers, profiling APIs, and the full performance-test workflow from setup to result comparison.
In this module:
- 1. Metrics: The Gathering
- 2. Metrics: Gather 'Em All!!11
- 3. Ruben's Infamous Guide to Profiling APIs in 2022+
- 4. Performance Testing Extension Package
Join to unlock the full module, audio, and resources.