
Loading screens and scene-transition hiccups are not a cosmetic problem. They kill momentum, they frustrate players, and they quietly make a good game feel worse than it is.
This module gives you the model most teams are missing: asset loading is not one thing. Unity goes through file access, deserialization, and asset integration on the main thread. If you do not know which stage is hurting you, you are just guessing.
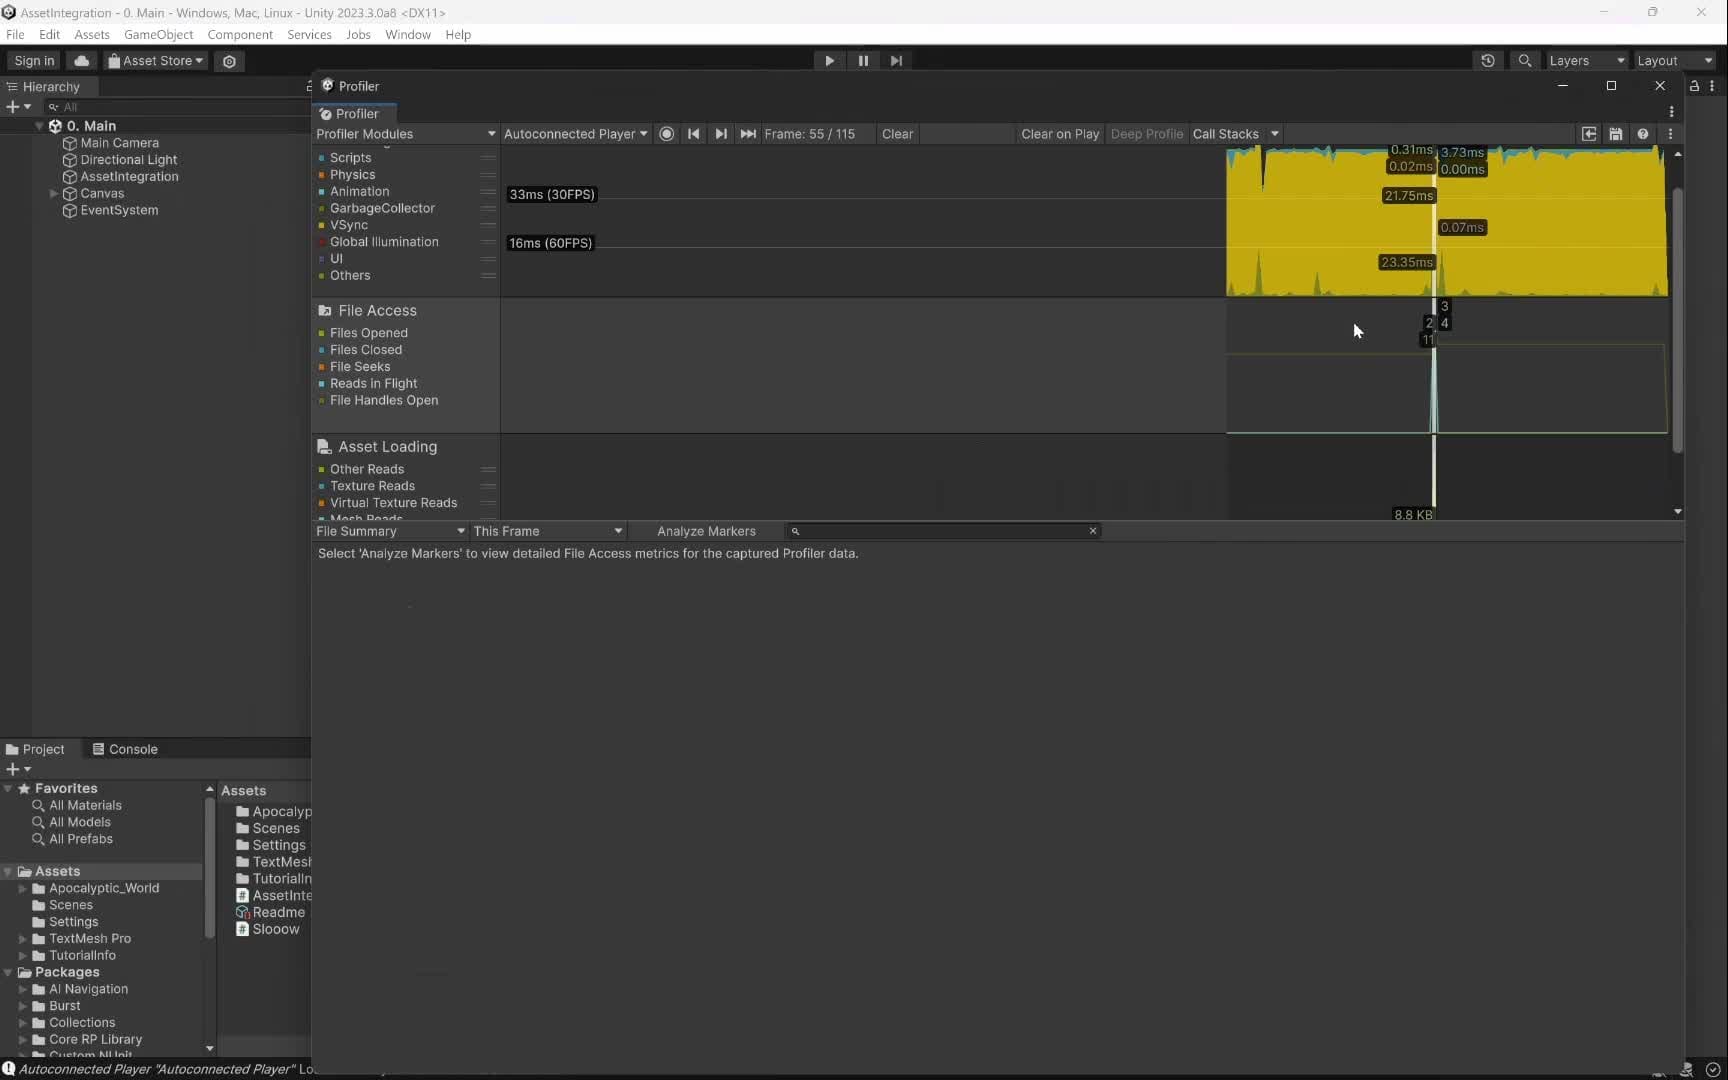
Start here: profile a build, not the Editor, then enable only CPU Usage, File Access, and Asset Loading in the Profiler. That is enough to see where the load starts, which files spike, and what Unity is really integrating.
First warning: a lot of the real pain comes back to the main thread. Awake belongs to the asset-integration step, and bad Awake / Start / OnEnable code can turn an async load into a hitch factory. The lesson is blunt about this: if you stuff expensive work into those callbacks, you will feel it.
First lever: use Application.backgroundLoadingPriority on purpose. High is useful for loading screens. Low is safer for additive loads and streaming because it spreads the work across more frames instead of smashing frame time all at once.
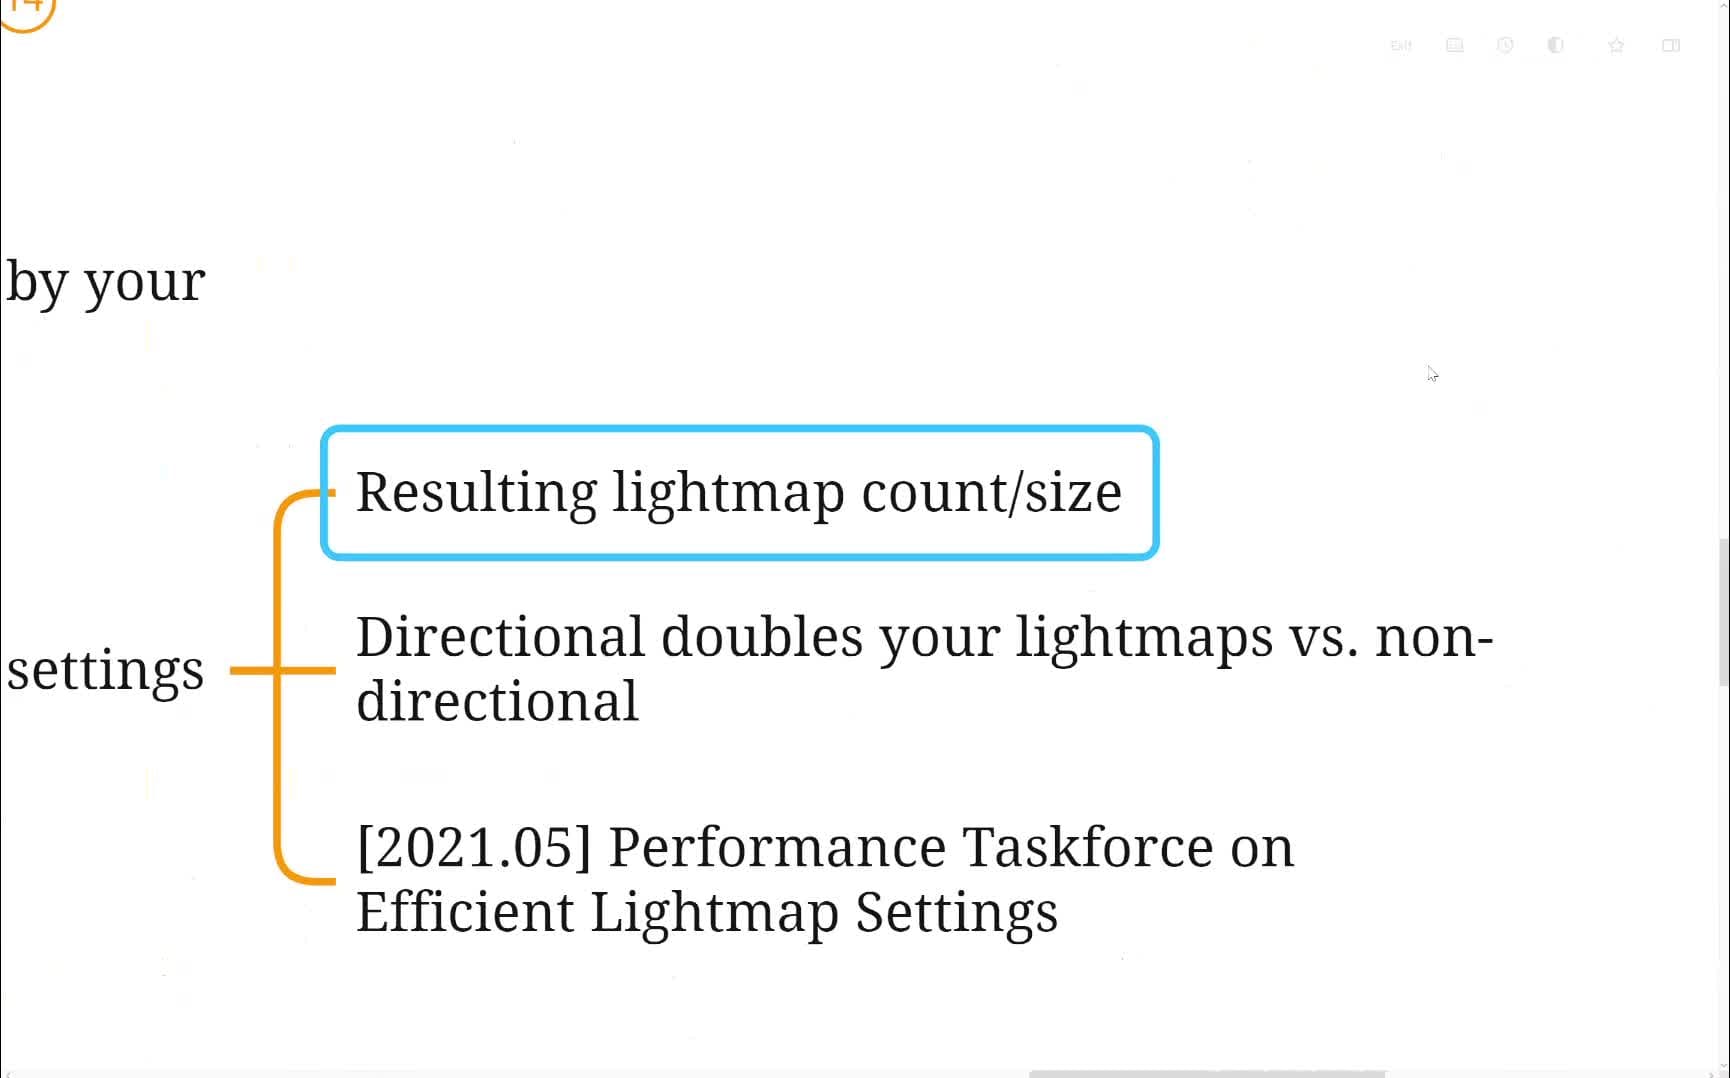
Proof matters: the examples walk through empty loads, script-heavy integration spikes, and a scene where lightmaps dominate the loading cost. That is the difference between "Unity is slow" and "this asset type is the problem".
CEO/Producer translation: shorter and cleaner loading flow protects retention. It is the difference between players staying in the loop and players feeling your content pipeline every time they cross a scene boundary.
The members-only module is the full step-by-step playbook: the full profiling walkthrough, the thread-by-thread interpretation, the asset-type-specific fixes for textures, meshes, lightmaps, scripts, and shaders, plus the examples that show how to apply the 20/80 rule instead of wasting days on noise.
In this module:
Join to unlock the full module, audio, and resources.