Stuck? Yep. Every dev gets stuck.
And the usual options are ugly:
A) Keep banging your head against the wall until you “figure it out”.
B) Pay for expert help.
C) Ask someone around you and pray they have the right context and time.
Here’s the missing option: treat an LLM like a technical assistant, and treat a VLM like a profiler analyst you can feed screenshots to.
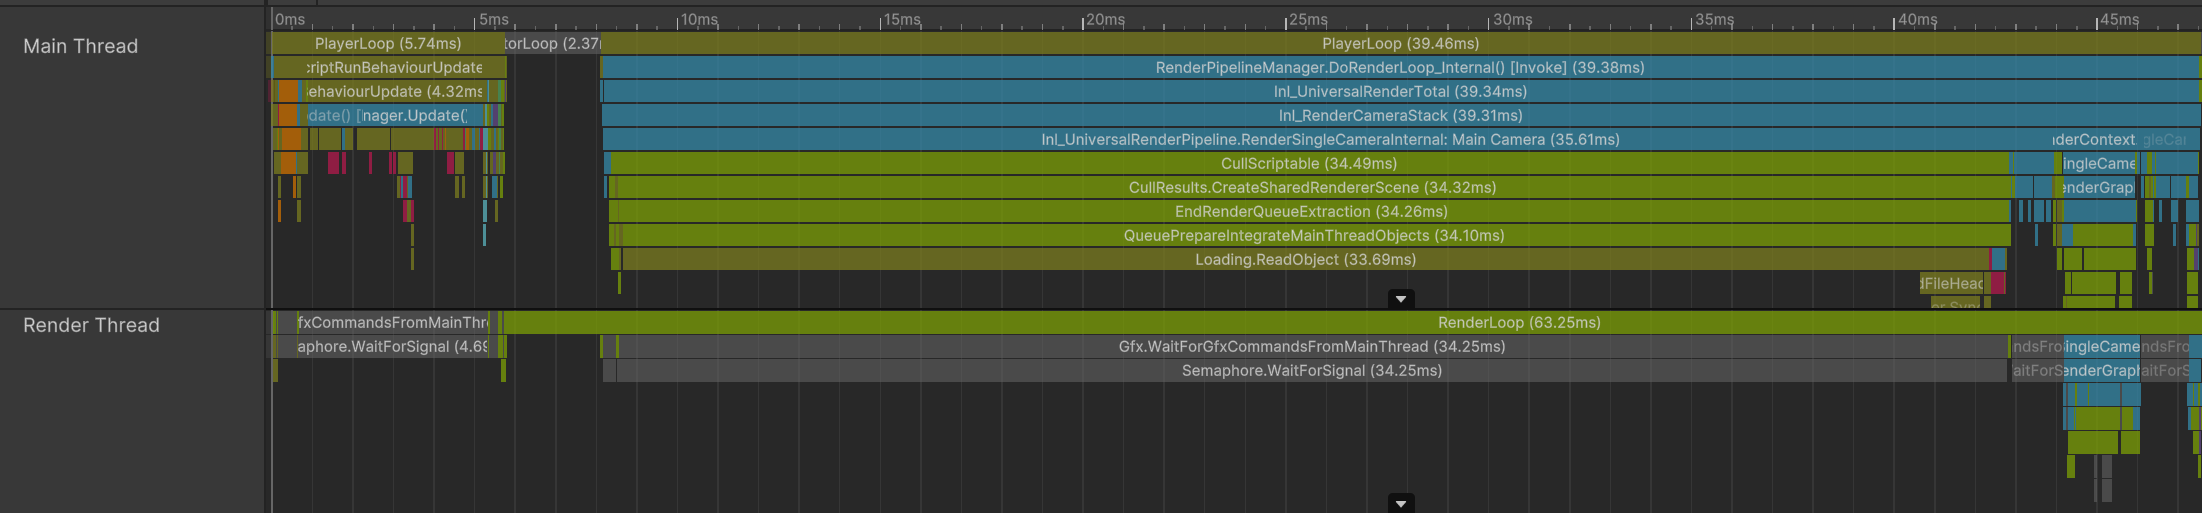
Free win (do this today): take one Unity Profiler capture screenshot and force the model to answer concrete questions, in order.
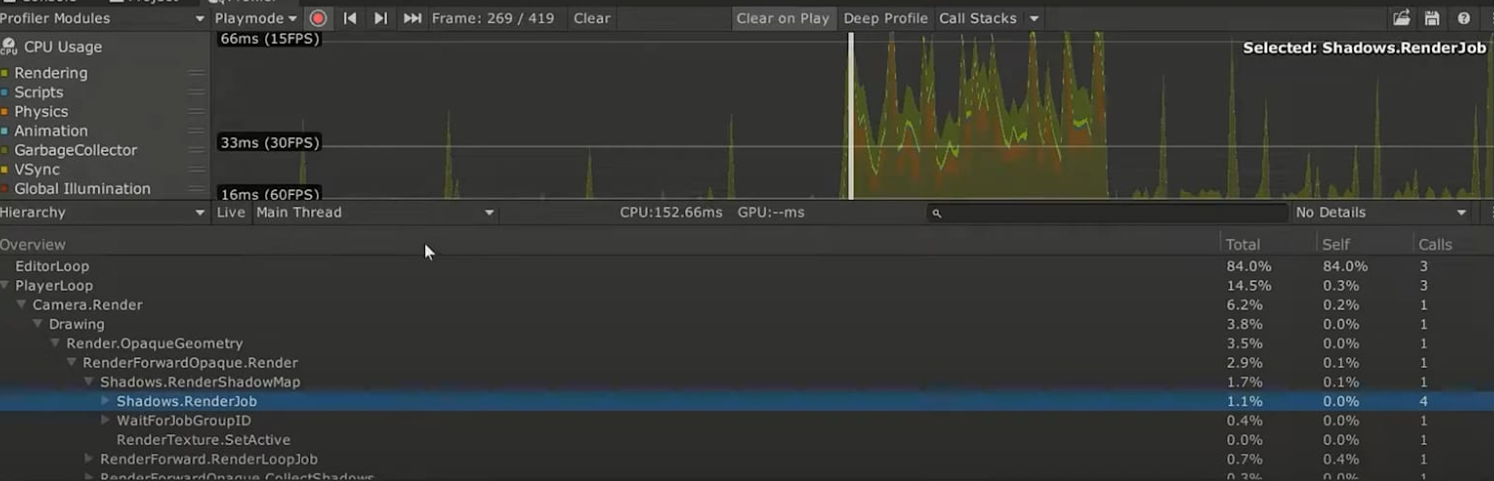
Ask:
- What am I looking at?
- What are the bottlenecks here?
- Are these costs normal?
- What can we do to improve performance here?
- What should I do next?
Then stop chatting like it’s a therapist. Give it a system message that pins it to your target hardware and your FPS target, and demand specific metrics and actionable recommendations (example included in the members-only module below).
CEO/Producer translation: this is how you buy back diagnosis time without hiring another senior engineer for every “what is the profiler telling us?” moment.
This is a small preview. The members-only module below is the full playbook: more use cases, how to scale this during production, when local LLM/VLM setups matter for privacy, and the copy/paste system-message templates.
Unlock the members-only module and turn “I’m stuck” into a repeatable workflow.
In this module:
Join to unlock the full module, audio, and resources.