If your Profiler says Rendering is expensive, you still do not know what to fix. That timeline does not tell you which passes, which materials, or which GPU state changes are killing you.
That is why this module exists: Frame Debugger is the microscope (per draw event). Render Graph Viewer is the map (high-level pass order + resource lifetime).
Fast workflow (editor): open Game + Scene at the same time, lock a stable aspect ratio, pause on a bad frame, then hit Enable in Frame Debugger. Now scroll top to bottom and you are literally watching your frame get built: clears, shadows, opaque, skybox, transparents, post.
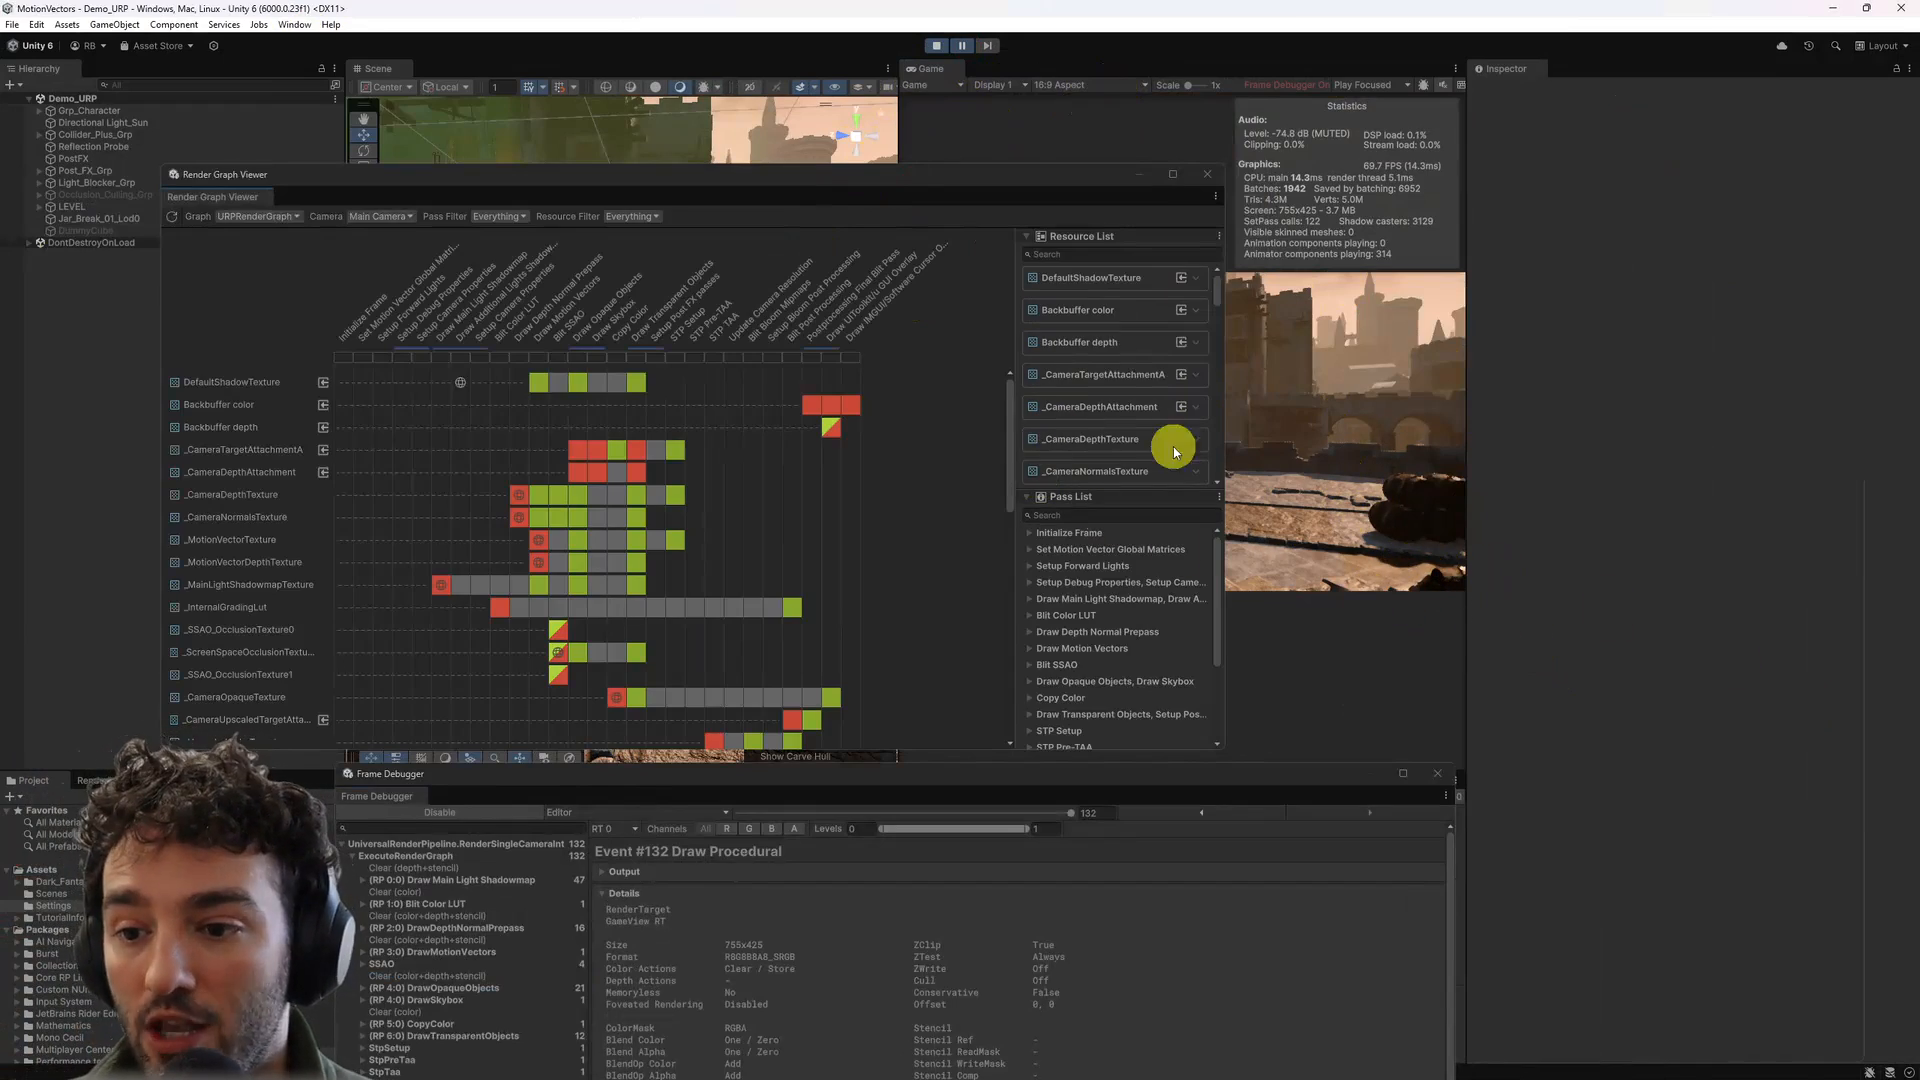
Render Graph Viewer (left to right) gives you the big picture first: where the frame is spending its time and which resources are read vs written. Then Frame Debugger tells you what is actually happening inside the block you care about (for example Draw Opaque Objects).
Two high-value tricks you should steal immediately:
1) If the output is too dark or “wrong”: it is often tone mapping or lighting that happens later. Do not guess. Use Levels, switch channels, and swap the inspected render target (color, depth, stencil, motion vectors) until you can see the pass you are analyzing.
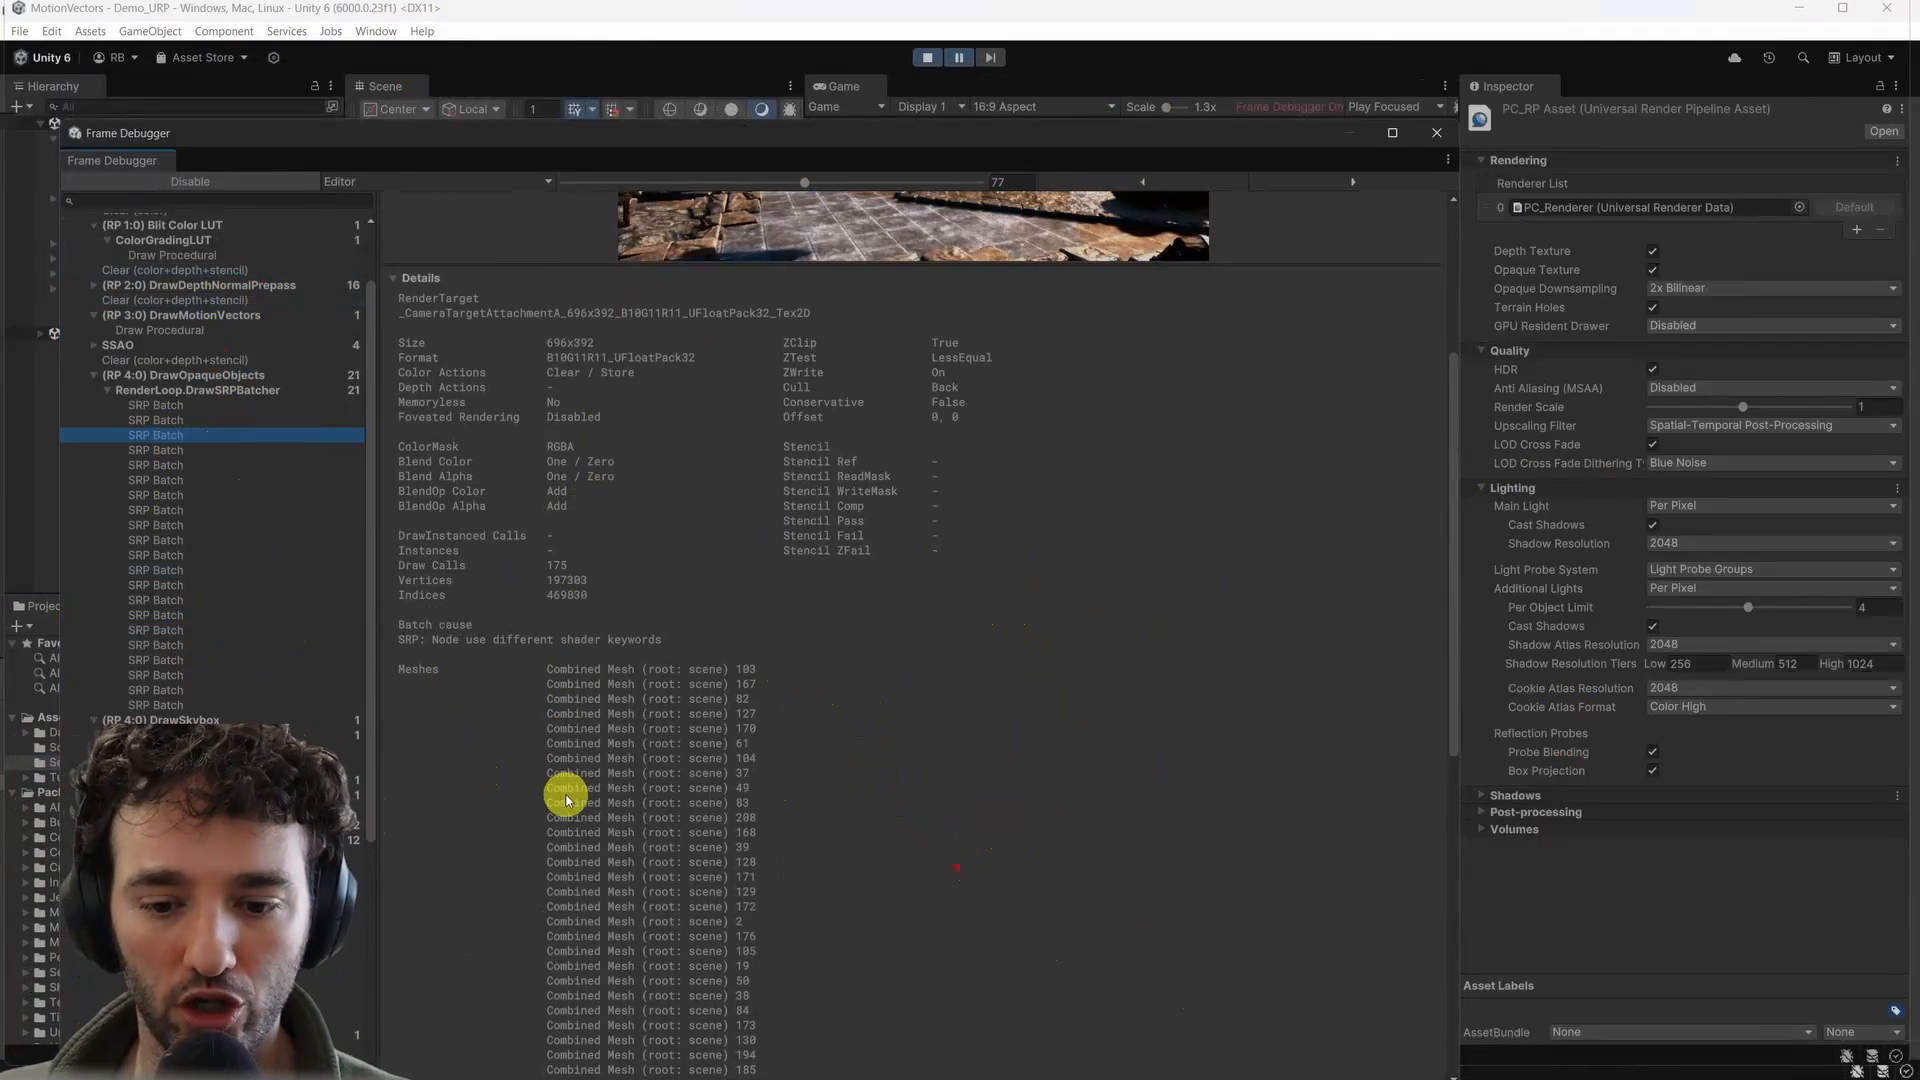
2) When batching breaks: open Details. You will see the render target size/format, blend/depth state, and the “why” of a batch split (a classic: different shader keywords). You will also see the real list of textures bound on GPU (not just what you think you set on the material).
HDRP note: the workflow does not change, but the surface area does. You will see hundreds of events under Execute Render Graph and multiple render targets (GBuffer and friends). Start with the big buckets (shadow maps, GBuffer, deferred lighting, transparents, post) and use levels/targets to make the output legible.
CEO/Producer translation: this is how you stop “we think it is rendering” and start fixing rendering with evidence. Faster root-cause isolation also means fewer regressions.
This page is a small preview. The complete members-only module (step by step, with the full videos) is below, including device attachment gotchas, pass-by-pass reading, and how to pair Render Graph Viewer with Frame Debugger without getting lost.
In this module:
- 1 - Intro - RenderGraph & Frame Debugger
- 2 - In-Depth Frame Debugger
- 3 - HDRP + Deferred Shading + Frame Debugger
Join to unlock the full module, audio, and resources.