
Today, I will show you around the neat memory map visualization mode that this experimental package brings to your table:
- How is your memory layout structured?
- What memory regions does Unity have?
- How fragmented is your memory?
This is the second post on the Unity Memory Profiler series. In the first post, I showed you what the memory profiler is and how it can help you visualize where you are spending your memory on.
Today, I'll show you around the memory map visualization mode.
What is Your Game's Memory Map?
The memory map is all about how Unity structures your game's content in RAM. That includes the engine content as well.
Now, your game might have GBytes of assets, but only a portion of that is placed into RAM.
Your memory map not only includes "content" (in the traditional sense of assets). It also includes our variables and other important data structures that we need for our gameplay systems.
Some examples:
- Variables in the heap
- Networking data structures
- Player stats
- Intermediate buffers of all sorts
- Memory pools, etc..
If you haven't heard of that yet, that's okay.
Your memory structure is something that Unity hides from you for an excellent reason: Unity game developers rarely need to be concerned about this.
However, there are a couple of cases where analyzing your memory layout can be useful, such as
- Fine-tuning your memory usage
- Developing cache-friendly systems such as DOTS
- Diagnosing and fixing problems related to memory fragmentation
In Unity, the chances that you need to go so deep into this topic are low, quite frankly. Some of these features are mostly for engine developers.
But you know what?
Learning about memory maps in game development is just exciting.
You get to know areas that almost no Unity game developer knows about.
Guess what happens when you talk about this in a job interview, or just in front of your #gamedev colleagues?
Let's see how to access your Unity game memory map.
Capturing Your Game's Memory Map
You can easily capture a memory snapshot of your game and open it for analysis, just like I detailed in part 1.
Ideally, you will want to do this in a development player build. Otherwise, you'll see a lot of noise coming from the unity editor (this is specially true when profiling memory).
On the top side of the memory profiler, you can switch from the default Unity Tree Map visualization mode to Memory Map.
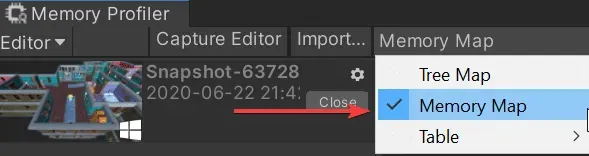
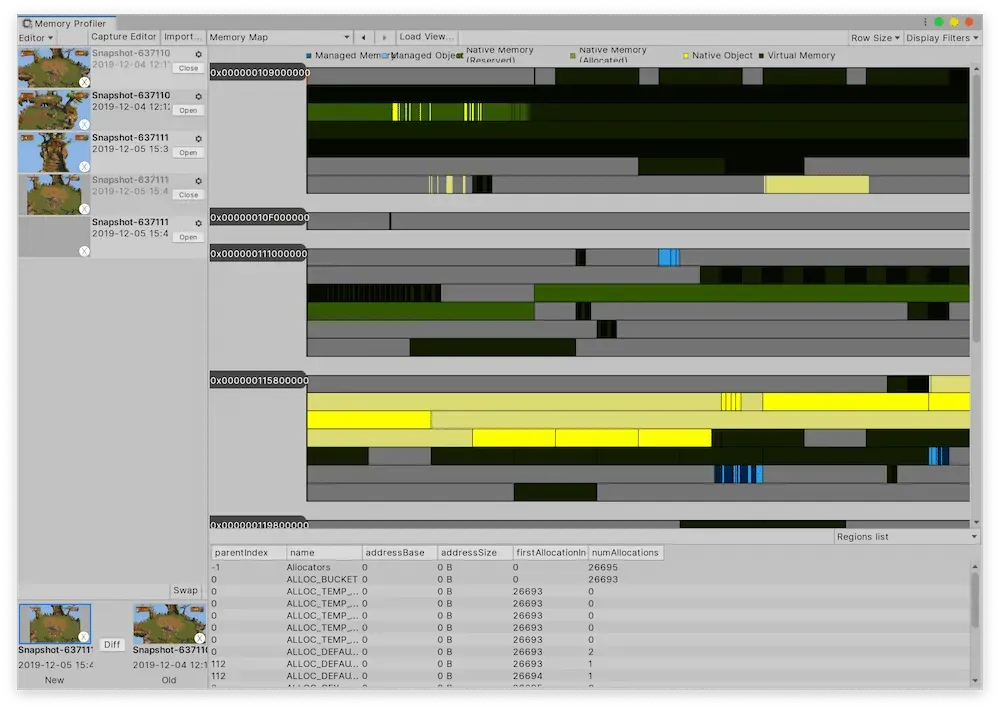
After switching to the memory map, you'll see something like this:
What the heck does this all mean?
As you can see, this displays how Unity lies out your memory in a linear, top-down fashion.
And these memory blocks you see have different colors according to the legend above:
- Managed memory and managed objects: blue
- Native memory (reserved/allocated): green
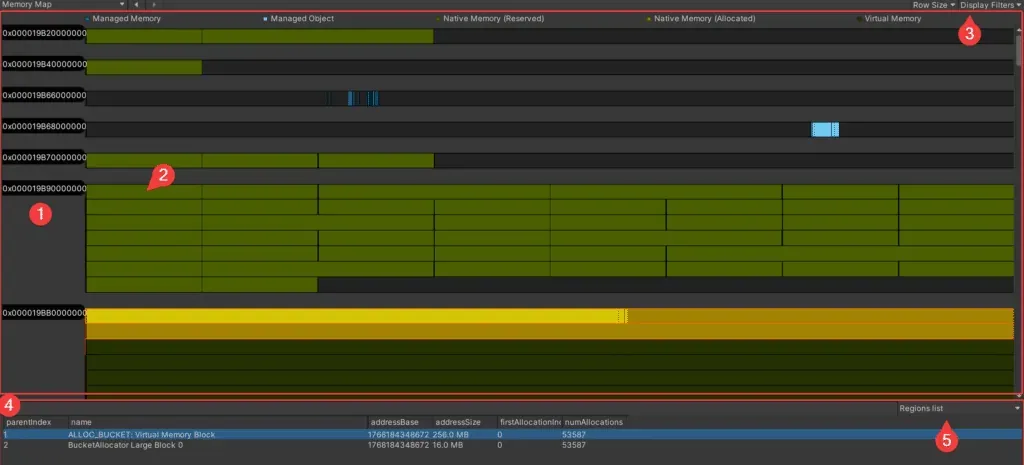
Let's get an overview.
- Virtual Address.
This is the current location (virtual address) of that memory area - Memory Blocks.
These are the blocks or "buckets" that Unity defines in that memory area. Each memory bucket has a memory specific storage function for your game. - Display Options.
There, you can adjust some visualization modes and filters. Not much to say about this, just play around with it. - Details Panel.
Finally, the juicy stuff. Here, it's all about what is inside the memory blocks you have selected. We'll talk about this in just a minute. - Details Panel — Visualization Mode.
Here, we can switch between seeing the memory regions, seeing the allocations happening inside and the objects living there. - There's no 6.
I just like ending lists in even numbers.
The interaction is pretty straight forward.
You can click on each memory block, but you can also drag to select multiple blocks at once.
Selecting memory blocks will update the details panel, which is the place where you can get the juicy details from.

What's In Your Memory Blocks?
In the details panel, we have three visualization modes:
- Regions list.
What memory regions did Unity put in these blocks?
In other words... what kind of data do we have here? - Allocations list.
What memory allocations have we put in this memory block. - Objects list.
What objects are living within this memory block?
Out of the three, I find the regions and objects lists the most useful. But let's give a quick look at them all.
The Regions List
The regions list gives you an idea about the type of data we are storing in these memory blocks.
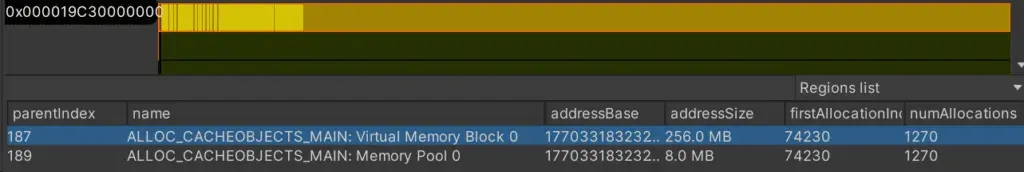
If you're curious, these are the regions I found so far:
- ALLOC_TEMP_JOB_X_FRAMES
- ALLOC_TEMP_JOB_ASYNC
- ALLOC_BUCKET: Virtual Memory Block
- BucketAllocator Large Block X
- ALLOC_PROFILER: Virtual Memory Block 0 + Memory Pool X
- Stack Allocator: ALLOC_TEMP_THREAD: (Virtual) Memory Block
- ALLOC_DEFAULT_MAIN: Virtual Memory Block 0 + Memory Pool X
- ALLOC_CACHEOBJECTS_MAIN: Virtual Memory Block 0 + Memory Pool X
- ALLOC_TYPETREE_MAIN: Virtual Memory Block 0 + Memory Pool X
- ALLOC_GFX_MAIN: Virtual Memory Block 0 + Memory Pool X
- Single Large Allocation Memory Block (multiple at different areas)
- ALLOC_DEFAULT_THREAD: Virtual Memory Block 0 + Memory Pool X
- ALLOC_GFX_THREAD: Virtual Memory Block 0 + Memory Pool X
- ALLOC_CACHEOBJECTS_THREAD: Virtual Memory Block 0 + Memory Pool X
The Allocations List
The allocations list gives you details about the individual data elements we put in this block.
This is more useful for engine developers so they can to see and optimize how efficiently we're distributing our game memory.
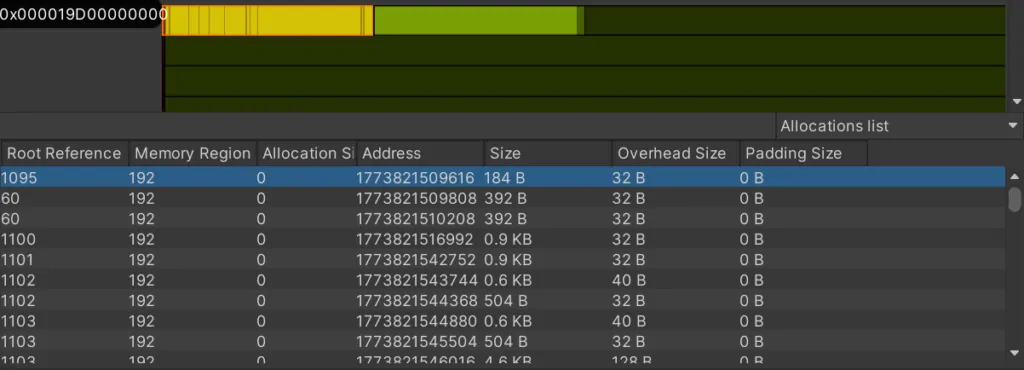
Not the best-looking table, I know.
The Objects List.
Finally, the objects list is arguably the most useful for us, Unity game developers.
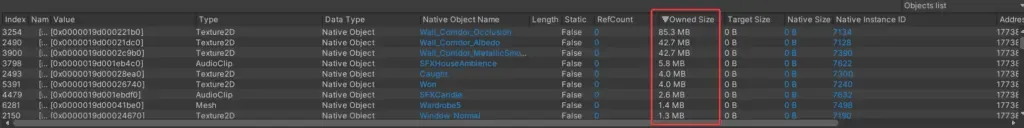
In this table, we see which specific objects live within this specific memory block.
This includes:
- Your scripts
- Mesh renderers, mesh filters
- Materials, textures
- Audio, etc..
You can sort and even group by specific columns. This way, it's just a breeze to find what game assets you should optimize next.
This table is useful for you because you'll easily be able to spot assets that have the wrong import settings.
For instance, if your texture sizes average 5MB and suddenly you see one at 30MB, there are few things that could be wrong about this asset:
- The texture's max size
- Its compression settings
- Mip-mapping, etc..
Neat tool, indeed.

What's Next?
Hard to say.
I'm actually impressed with the capabilities of this Unity memory profiler package, considering the fact that there doesn't seem to be much effort around it.
Honestly, for the common memory profiling session I'd rather go for the traditional Unity profiler.
I'd just open the memory profiler module and capture a snapshot in detailed mode.
Why?
Because it just takes less time and you get 80% of the results from the traditional profiler. And you don't have to install an experimental package.
However...
There a few cases where this experimental Unity memory profiler package might come handy:
- To analyze memory fragmentation, useful for memory-intensive games that need further optimization
- To diff the memory layout between different game sessions, useful to diagnose "memory leaks"
We will see them in next episodes of the Unity Memory Profiler series, so stay tuned.
Lastly, you can get many more Unity game optimization strategies from my Unity performance checklist.
Grab it now and take a huge leap in optimizing your game so you can deliver the gaming experience your players truly want.
Get the Unity Performance Checklist
Sign up to access the checklist and companion resources in your members area.
Already a member? Open this resource.
Take care and see you next week!
~Ruben