About this document
The main purpose of this document is to tell a story. That is the story about the steps and methodology I followed to diagnose and improve the performance of Catan Universe in mobile (iOS, Android) with important benefits to WebGL. As such, I may start by describing the relevant facts surrounding the game itself and I will conclude with general tips you may find helpful for your projects. The reader will surely be familiar with many of the hints I present, but I bet some other unknown facts will come surprisingly handy at times. All in all, I will present the techniques I used to move from virtually 0-2 FPS to 50-60 FPS in about two weeks. Indeed, it is not lots of time so managing it well was one of my priorities.

Introduction
Time is scarce, expensive, irrecoverable and the adjective list goes on. We don’t have much of it in life, that’s why we, the developers, are likely the most expensive resource in the games branch. To spend time wisely it is often a wonderful idea to do pre-research on the different options one may have to accomplish one’s tasks. And yet, no amount of research and preparation will save you from making painful but well-needed over-hours.
This document has been written across different days; cohesion might appear to be a bit off. Also, the structure of this entry is rather inexistent, but if I were to outline one it would be the following:
- About this document
- About Catan Universe
- About me
- Objectives
- Starting point and reference devices
- Catan-specific optimizations:
- Optimizing MainMenu
- Optimizing In-game
- Generic optimizations:
- Memory allocations
- Materials
- Textures
- Shaders
- Audio
- Extra:
- Camera imposter system
- Unity Plugins
- Tools
Needless to say, I am open to constructive feedback and conversations that will point me towards solving issues and making improvements. Negative feedback (trolling) will be largely ignored.
About Catan Universe
Catan Universe is a 3 year old project that has been actively developed since then. Its core team consists of about seven developers and two artists, although in certain periods we have had up to 12 developers, four artists, one dog (Gaucho) and some typical management overhead. From its budget it might not be considered a AAA game but we have indeed put a good amount of resources and love in it.
Catan was originally developed for PC and WebGL; issues were therefore to be expected on Android and iOS. Naturally, standalone platforms are usually much more performant and one doesn’t have so many constraints as in mobile solutions.
About me
I am Rubén Torres Bonet and am working as a Technical Lead at Exozet Games. I represent my company in game development and am in charge of improving our processes continuously. I have worked in games such as Catan Universe (surprise), Diamond Dash, Jelly Splash, Blackguards, Carcassonne and way too many 3D/VR/AR projects for clients such as Volkswagen, Audi, etc.. I do have experience with PS4/XBO consoles, Vive, Hololens and mobile VR. Personally speaking, I have a special passion for architecture, graphics and also for managing technical teams.
I have very specific answers to the question of why do I share this document: (1) it forces me to drill deeper in every topic so as to maintain the correctness they deserve, (2) it helps me reasoning systematically about the decisions I meet, (3) it favours knowledge spread by helping other developers, including the ones of my team so as to reduce my bus factor and (4) it’ll avoid me forgetting all the cool stuff (and mistakes) I’ve done.
Objectives
We have a very simple objective: ensure smooth gameplay by committing to having consistently 30+ FPS in every scene while avoiding hiccups and keeping load times to a considerable figure.
Our starting point
It is important to document the starting point of our journey. Documenting such a process will help the reader—including me, at some point— noticing the work that was put into it and the concrete reasons for the decisions met. Such a process is long and always start under a specific context.
Our starting point is an on-going development of a PC and WebGL version which runs well enough on those platforms. We don’t want to wait for a perfect version to be released—that might be too late for its porting— and our improvements can also well benefit the original platforms, especially WebGL. It is also important to have a basis to run benchmarks on.
One must choose some reference devices that will guide oneself throughout the process. We always need them to be able to judge whether we are doing good progress, just like the marks at school gave us feedback on how we were progressing. It is important to make a rational choice about it.
When considering devices, it is important to achieve a compromise between the target market size and the videogame (visual) quality you want to deliver—the larger market you want to approach, the worse quality you will have to deal with since many people are using still old devices that can only render 1D—. You can do some research in pages such as Unity Hardware Stats and OpenGL ES Hardware Database to take a decision that suits you. In our case we decided to go for a Samsung S4 and iPhone 5s (and potentially 5). Now, what do we do with that info?
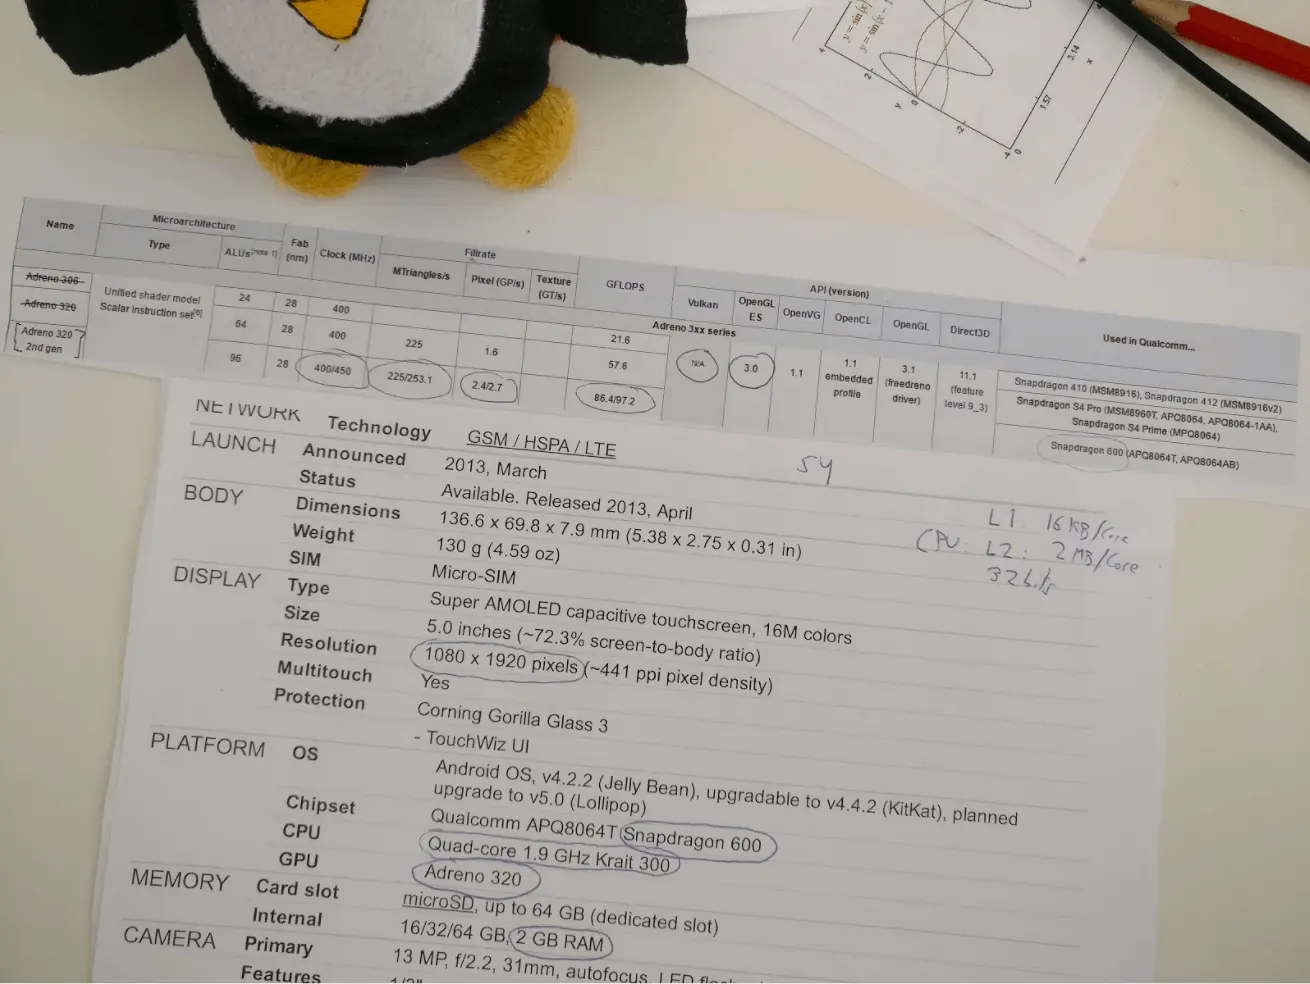
The next step that I took was to print the specification sheets to have them at hand all times so I could give it a quick glance whenever I had questions about the hardware behind it. That way I could relate specific issues I find in the software side with the hardware it runs on. For that I searched with the omnipresent duckduckgo search engine and was forwarded to sources such as GSMArena and Wikipedia where I got most of the information I needed about the hardware specs of the CPU, GPU, RAM, screen, etc.. Afterwards I got to print that information in a highly-skilled DIY style so I could leave it around my table at work while working on the project. For our Android reference device I found the following specifications most relevant:
| CPU | Brand, features, cores, frequency, cache size. So S4 has four cores which is more than enough for our project. The frequency is not especially high but it will have to suffice considering it is a mobile platform and power consumption is indeed a concern |
| GPU | Frequency, cache levels, number of stream processors, fill-rate and OpenGL ES version. Since many performance optimization techniques rely on the OGL ES version, it was a must to have that information at hand |
| RAM | The S4 has 2GB, alright. That is ok, but probably not enough for keeping running Catan on the background as it will be likely to be killed by the OS when minimizing it. Not good but that’s life |
| Supported OS version | In the case of S4 it supports Android 5.0.1, so that is something we have to consider if we use specific plugins that interacts with the OS |
After having decided which devices we will support, a natural step towards our objective is to get a running version on them to find out how far away we are from the aforementioned objectives. After fixing compile and linking issues proper from targeting a new platform, I got a version running on a Samsung S4. I kept my fingers crossed while launching it—by the way, that didn’t help—.
Catan-specific optimizations
Are you ready for it? Let’s start with Catan!
Main Menu
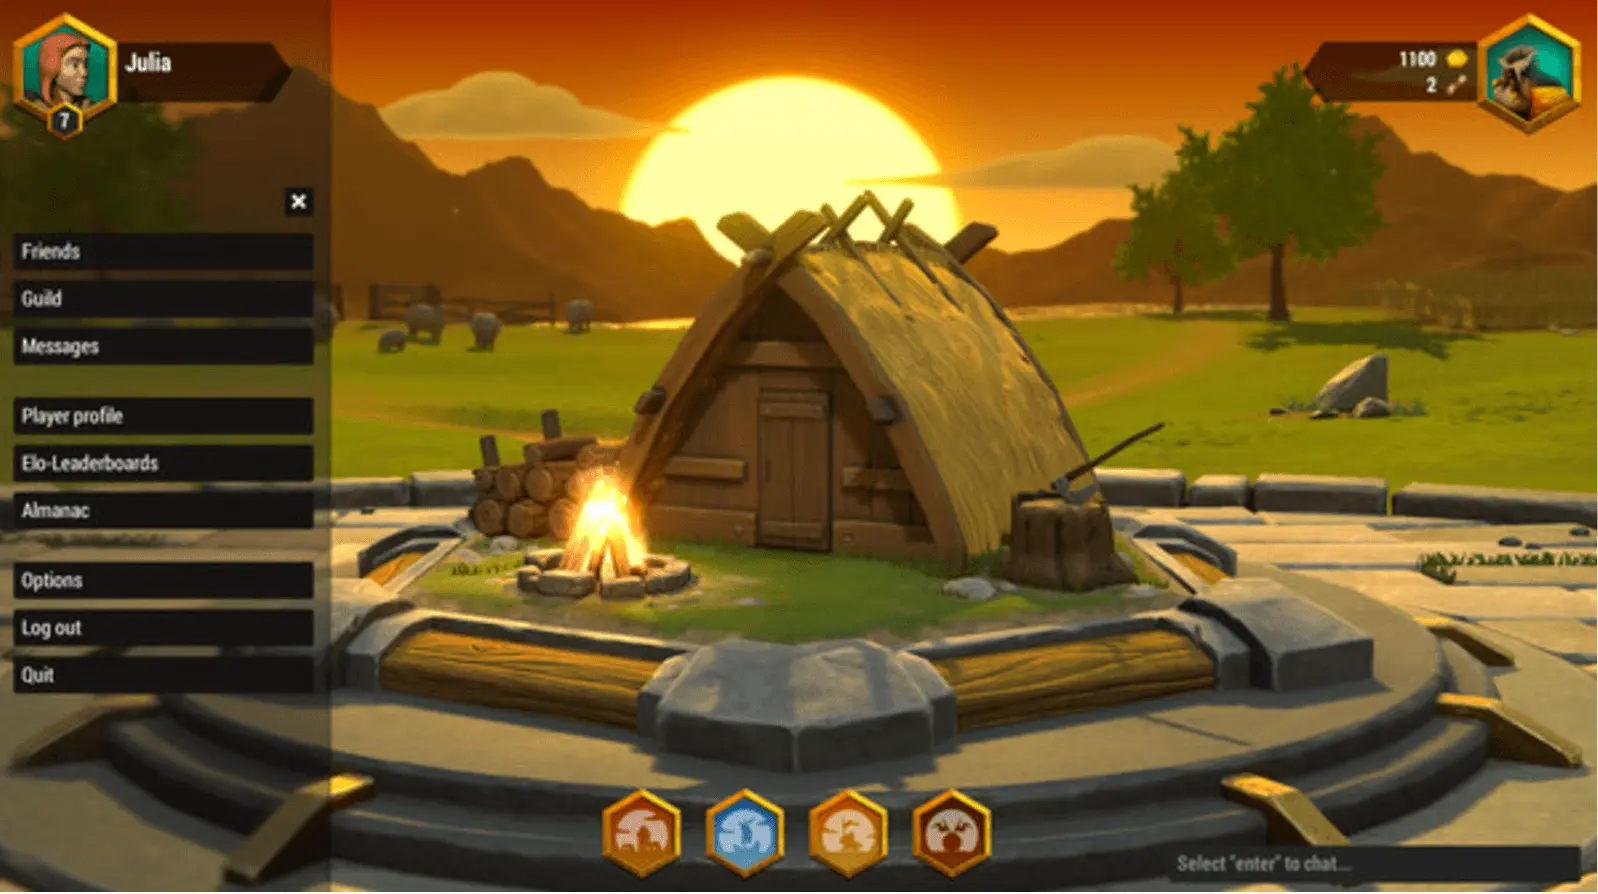
The Main Menu is basically the first real scene spawning in Catan and is also the entry point for other scene transitions so it makes sense to start optimizing this one. I deployed it on a S4 and stole this screenshot right away with my friend adb:

Some shaders were broken, but I am ok with that for now. You see that 1 in the bottom-left part of the screen? Yep, not milliseconds but rather FPS which are rounded up, by the way. I got that figure even without most of the UI elements. The first time I saw it I gazed at it for at least a minute before realizing the amount of work that had to be done; it is indeed a good KPI. Since time was quite inexistent, I had to figure out how to achieve the most in the least amount of time possible.
Luckily enough, I was paying attention at some point during my classes at University and found the Pareto Principle pretty fascinating and straightforward. That one meant: I have to find the 20% of the issues that are causing the 80% of the performance bottlenecks. And there are indeed good tools for this.
I chose RenderDoc as a starting tool since it offers a pretty quick workflow when it comes to figuring GPU bottlenecks. With a few clicks you can capture a single frame and calculate the draw event timings to figure out where the GPU might be spending the most time in—sure, simulations are performed in Desktop, but the relative times aren’t so different except for rendering transparency which is much more expensive on mobile because of its tile-based rendering techniques—. So that is what I did and found some (un)surprising facts.
Image effects were responsible for a huge part of the issues—bloom, depth of field and color correction— and as such one has to decide how they should be removed. One option relies on adding a script that dynamically turned them off on Awake. In our case I ended up creating a new scene with the mobile variant, since many other mobile-specific changes were to be expected and compiling the image effects shaders took too long (1-2 seconds). I duplicated the scene, baked the lighting, made some code changes to the process followed to determine which was the scene to load and made thousand fixes, nothing fancy. After turning them off I instantly got +5 FPS, not bad for a 20 minutes task (10 of them being deployment). Still, there is a long way to go to achieve a performant main menu.
Another issue I detected through Adreno Profiler is the high computation power spent in shaders. The shader ALUs were 95% busy, meaning that we were using complex shaders and/or many light sources. As you may know, mobile is basically bound to forward rendering so each light will create a new pass in your shader (up to a limit set by your quality settings in the number of dynamic lights section). Since we didn’t have complex geometry, it had to lie on the fragment shaders complexity. Effectively, we were extensively using standard shaders and also custom shaders that were never thought for mobile. I replaced the standard shaders with the mobile bumped diffuse shader and consequently the performance increased greatly. I also optimized some custom shaders not to use shadows and reducing the operations and memory accesses it required. Yes, I got an important performance upgrade but the visual quality got really debuffed; nothing I am ok with.
I decided to spend more time researching alternatives to improve the visual quality and came up with helpful ideas, so bear with me. In main menu the camera is static and also most of the background objects are static as well, excluding trees and sheeps because of animations. That means, we might take that into advantage in different ways to get a better quality-performance trade:
- Static & Dynamic batching: it helps with reducing the draw calls but that wasn’t the issue here (complex fragment shaders, some overdraw). Anyway, it was already kicking in.
- Geometry instancing for some elements: discarded as we have to support devices that do not offer this feature. Also we didn’t have much repeated geometry, most of them were unique.
- Rendering the static elements offline into a screenshot for its per-frame drawing in the background. That works but there are several drawbacks:
- Which resolution do you take the screenshot at? If it is different than your device, heavy sampling will occur which will, again, drop the visual quality.
- Manual positioning of the screenshot in the editor in such a way that it is still coherent with the rest of the 3d objects is a tedious process. Also, be careful with the depth information (and fighting).
- It is indeed a slow workflow. Every time you change something from the scene you would need to take a new one and set it in the right position. This is surely the worst drawback.
What if we followed a hybrid approach? We might be able to use the right resolution if we took that screenshot in real-time rather than in editor-time and substitute the real 3d geometry with the screenshot we just took. That way we would solve all the drawbacks coming from taking a static screenshot in the unity editor while keeping a relatively high level of quality, including complex shaders and all kind of post-effects. Sure, we have to render the scene still, but only once! Afterwards we could store the render result in a RenderTexture. It’s worth trying, right? I still remember how excited I got about this idea before realizing how problematic some issues would be.. Check it in the Camera Imposter section!
Still looking for making the most of my time I thought about how useful it would be to have remote hierarchy support so I could inspect, turn off and turn on both gameobjects and components from the active application being run on mobile. For that I took 20 minutes of my (free) time to develop a small system running in the unity mobile player polling a webpage hosted in my computer. There I implemented a set of commands like disable_XXXX, enable_XXXX that I could “send” the client for it to obey. It allowed me to discover which game objects and settings were causing the bottlenecks just by disabling and checking its performance impact with Intel System Analyzer.
Even if simple, that spontaneous tool quickly proved to be a powerful idea that was worth extending. I came across a plugin that would exactly do that: Hdg Remote Debug. It allowed me to connect to a remote device via wireless and inspect its hierarchy remotely. It is not perfect, as you have to do some workarounds to make it work with DontDestroyOnLoad objects and not all important component properties are actually serialized. For instance, I couldn’t change the material of mesh renderers (which is probably difficult to implement though). Yet, it was 60€ well spent that helped me detecting bottlenecks without attaching debuggers, profilers or frame analyzers. Once I knew where the biggest bottlenecks were, I could put more resources into researching them individually.
Do not forget that this document is only a summary in which I filtered all the irrelevant information that isn’t useful for the reader. Much more work and specific modifications were put into it but hasn’t been even mentioned here. After all of this I am sufficiently happy with our main screen performance for now, so let’s jump in-game!
Catan in-game
The heart of every game is in-game, so let us quickly deploy a version and start a match to find out where to are standing. Just at the beginning of a game we get stable 12 FPS, which is already quite good coming from Desktop. However, that figure dropped tremendously when making actions such as building roads; that is, we get FPS spikes likely coming from CPU (scripts). Surely we want to avoid them not to give our players enough time to make a coffee break, so time to do some investigation!
Let’s get to ingame so we can have a look at the stats and scene hierarchy in the editor.
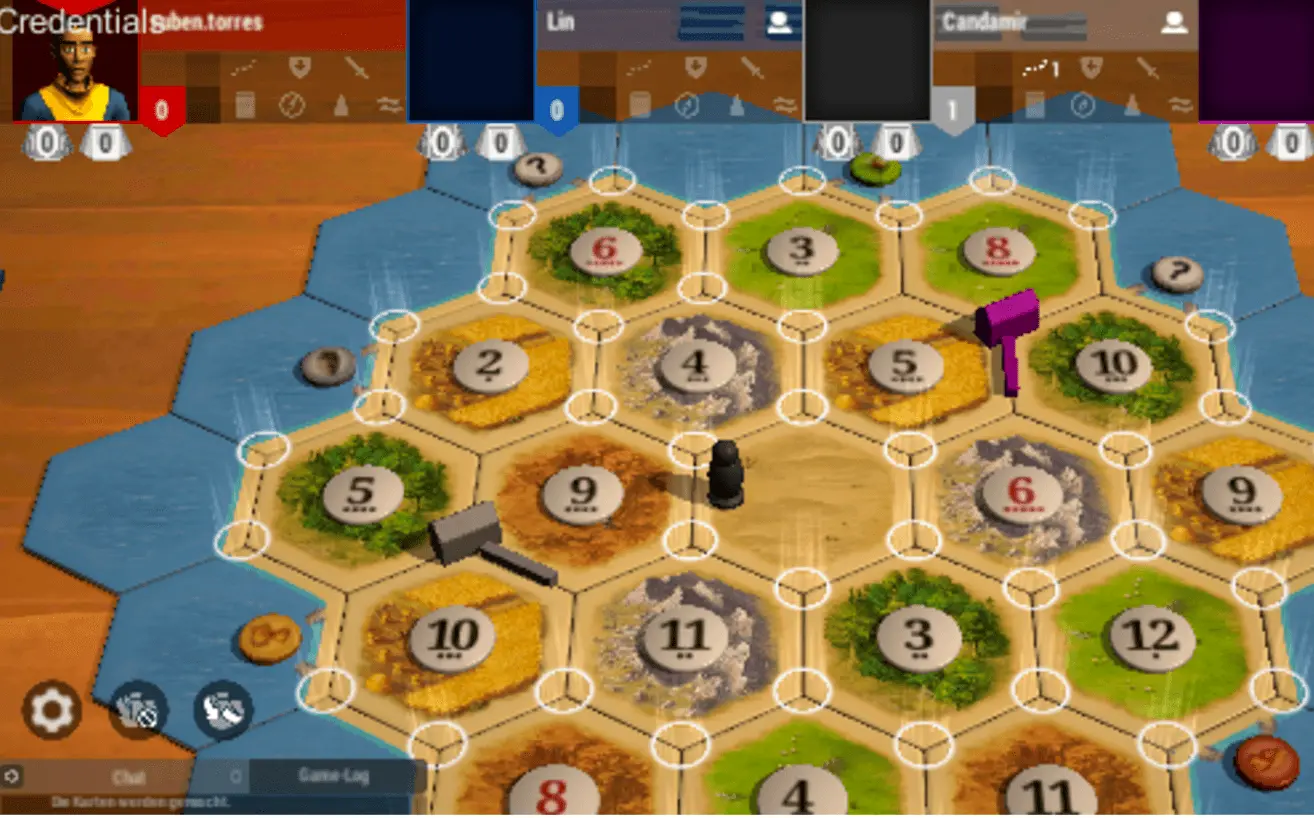

Approximately 50k triangles, 170 draw calls, 70mb textures, 45mb RT, 140 shadow casters. Not bad. Probably we have too many shadow casters and draw calls for mobile, but nothing too crazy. We might consider reducing the amount of draw calls but it might be a safer bet to find other real bottlenecks.

Now we have something. 400mb in textures? That’s a lot. It is indeed a must to reduce texture sizes and set compression formats specifically for Android/iOS; that will be the first task I put in my todo list. Less texture data means less bandwidth waste and therefore shaders won’t stale too long while waiting for the sampled textures to arrive, meaning we achieve less power consumption or more performance.
Audio takes up to 61 MB: welcome in my to-do list as well.
Every passive frame (no action taken) is creating 7KB of garbage split in 138 garbage allocations! Impressive; that is way too much over my standards. It is a figure that has to be reduced in order to avoid triggering the GC too often; that will only produce framerate spikes. Again, welcome in my to-do list. Great, the list keeps growing! I decided for doing more research, so let us use another tool.
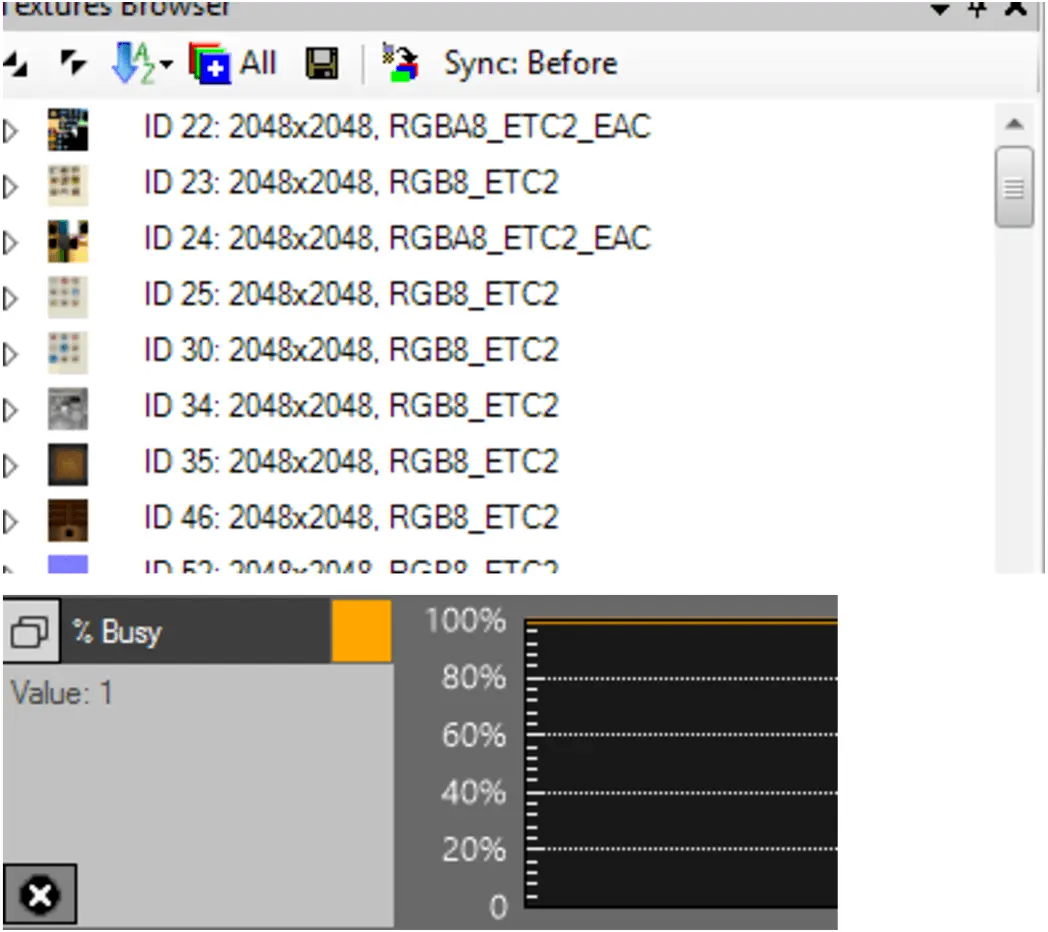
After starting Adreno/Snapdragon profiler I captured a frame to detect further issues and made a screenshot to convey the issues.. As it shows, textures aren’t doing especially well as there is a high number of relatively-big textures being uploaded in every frame, taking up a big portion of the RAM capacity as well as bandwidth requirements. That isn’t acceptable and will have to be corrected. What else did I find?
The overdraw figure also caught my attention: the profiler states that there is a 158.26x overdraw factor, which sounds dreadfully. Let’s take it into account in the future without worrying too much about it for now, as we have better tools at our disposal for that. Let’s continue.
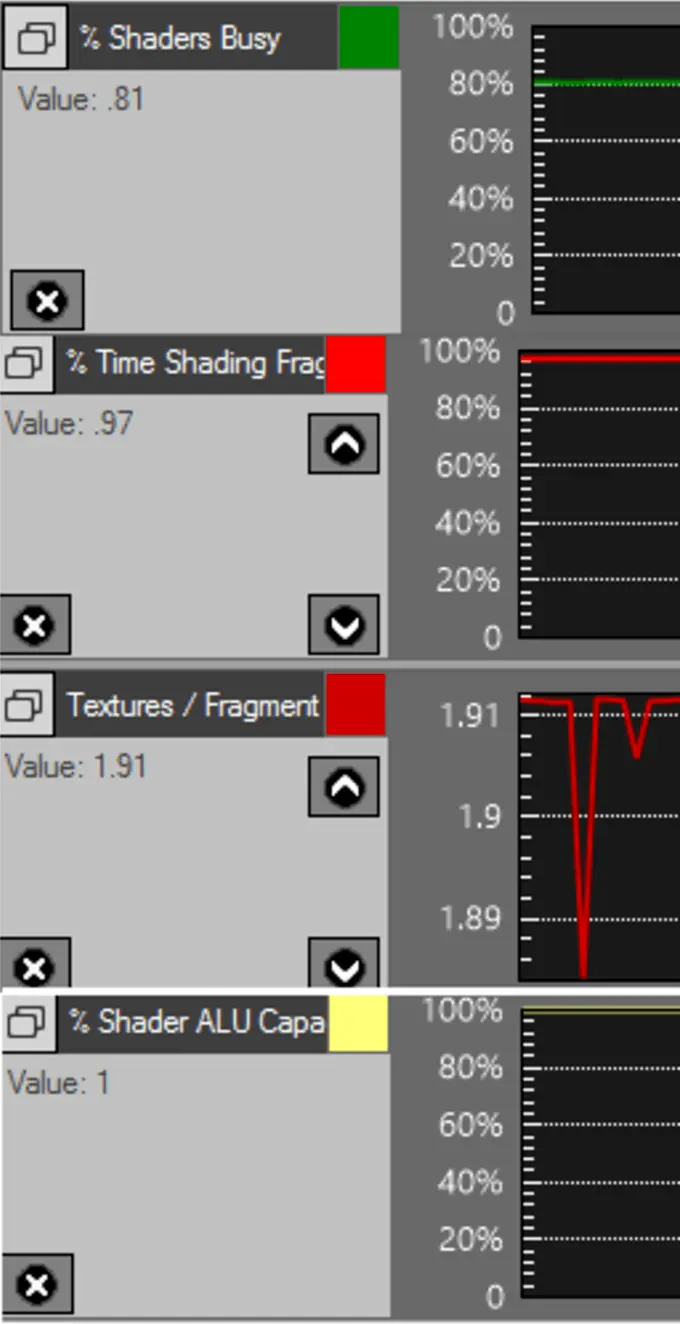
The GPU busy percentage remains at 100%, how surprising. I also checked the % Vertex Fetch Stall and it remained stable at 4%, meaning that the bottleneck is unlikely to be in the geometry data but it is still something to consider. The % of texture fetch stalls is however at 12%, which is quite a higher figure and I would expect a framerate increase after working on the texture sizes. Nothing too dramatic yet.
A more interesting graph is the Percentage Shaders Busy section which lies between 75 and 85 percent. That points to the probability of the GPU doing an excessive amount of expensive operations in the vertex or fragment shaders. Overdraw could be one reason for it; visible materials should be checked. In any case we see in other sections that we are spending lots of time doing fragment shading calculations with about 2 textures per fragment—albedo+normal— in average. My bet is that we are using the standard shader in too many places and that is overkill for mobile. Checking the % Shader ALU capacity confirms that we are doing too many operations that are not really dependant on accessing memory but rather on pure computational power.

Optimizations
We did a pre-research so as to get hints about where the problem could come from; now we are going to the specifics of the scene.
My first experiment was to remove all light sources except one, since every of those will cause an additional extra pass in the shader (forward rendering). I left one and faked the lighting on the rest of the objects with tint colors animated through material property blocks. The biggest optimization is yet to come though.
As I mentioned before, the standard shader is pretty expensive in mobile so we should definitely go for simpler lighting models. I replaced all of them with diffuse bumped or even unlit shaders. I got +3 FPS just by changing the shaders from the table on which the boardgame takes place. So I did the same with the rest of the objects and that provided a huge boost in the frame-rate. Since we use dynamically instantiated prefabs and we want to keep the original quality in desktop, I had to think about a system that would allow us to switch in compile-time between material types depending on the platform. How is that?
One option for replacing materials in a per-platform basis is duplicating prefabs and materials. If we have Horse.prefab and Horse.mat, split them into Horse_desktop.prefab, Horse_mobile.prefab linked to Horse_desktop.mat and Horse_mobile.mat respectively and modify the code that is spawning them to differentiate between platforms with either macros (e.g. UNITY_ANDROID) or run-time checks (Application.isMobile). Be careful though: settings references to both will include both prefabs and their linked resources (materials, textures, shaders) in all builds still. You see how much fun you will have per prefab: out of two files you get four. Maintaining it could become really expensive but one achieves a great degree of flexibility. I didn’t feel like paying this high price so I researched about other possibilities of changing materials.
Let’s consider for a second the option of rendering manually through camera.RenderWithShader. There, one can specify in runtime the shader to be ran depending on your device capabilities. Although it sounds well, as one may use simpler shaders for cheap devices, it would add a few extra problems: first of all, it is a manual approach that tends to break with version upgrades and all kind of modifications you make on the scene. It is expensive to maintain and since you are rendering manually, it tends to obscure the simple nature of Unity where you usually see what you get per scene. Not only that, but rendering with a different shader is just a part of the whole story; one needs still different materials, textures and parameters that are really difficult to pass this way. Maintaining the material information is even harder than all of this. For all of those reasons I am not willing to pay this price for gaining performance; there must be a better way.
And the better approach just came to my mind. I went to add a script ran in compile-time which mission is to search through all prefabs in the project (in the Assets directory) to check all their renderers for a linked material whose name ends with _desktop(.mat). If found, then it replaces that reference link with its _mobile.matcounterpart that should have been added by the artist. That script is ran before every build and its changes are reverted whenever it’s done in order to avoid confusing git. With that in mind, we achieve the fact that all prefabs contain references only to mobile materials (if existing), throwing the desktop materials away and therefore saving up precious memory and shader compile time. The workflow remains simple: if you want an expensive material to be simpler for mobile, just rename the original to _desktop, clone it to * _mobile* and do the wished changes; the automated build steps will do the rest. Since this method led to some curious questions I decided to detail it a bit more.
For me, it was important that the material script would work automagically without the user needing to run scripts explicitly. In other words: I wanted it to be executed both while building with ctrl+B and also when invoked from our build pipeline based on UBS. I checked the documentation and it happens to exist two interesting annotations: [PostProcessScene] and [PostProcessBuild]. Both let you modify the scenes and the whole build “before” (despite its name) it is finally built, so it is indeed an interesting place we could hook our process into. It is enough with adding them to some methods of a MonoBehaviour class of your choice; it just has to reside in an Editor directory. Those methods will be later called by Unity in a very confusing way that that initially surprised me. In any case, to sum up the behavior of my script:
| Step | Description |
|---|---|
| 1 | Select *build & run* (ctrl/cmd + b) |
| 2 | *OnPostProcessScene* is called per scene. Here I run my material switch script if two conditions are met. The first one is that the unity editor is not playing, since this method is also affected by changes in play modes. The second one is that it mustn’t have been run already, since it is to be ran only once during the build process |
| 3 | My material switch script searches for all prefabs in the project through *AssetDatabase.FindAssets(“t:prefab”)* |
| 4 | For every prefab, we find all renderers (skin mesh renderers too) with GetComponentsInChildren and fill a list with their materials |
| 5 | For every material, we check if there is a *\_mobile* version in the same directory. If so, replace the original reference to the mobile one |
| 6 | I set a flag so the script doesn’t run again for other scenes |
| 7 | The build is just before completion and *OnPostProcessBuild* is called. In that script I revert the changes made to the prefabs if two conditions are met. Like before, I check that the editor is not in playmode and that there is something to revert. Reverting is an important step of the process to avoid git showing thousands of changed files, including prefabs and scenes. The way I chose to revert is calling checkout on the list of prefabs I filled before |
| 8 | As a user of this script everything is back to normal but our final APK/IPA will include the mobile materials and exclude the desktop ones, being a fully transparent process for the rest of the developers |
Generic optimizations
Now that we spoke a bit about Catan, let’s jump into more general performance tips. Some of them I learned through experience, others through research and experimentation, blogs and technical posts were also visited and as always, over-hours help. We’ll talk about memory, materials, textures, shaders and audio. Grab some popcorn!
Memory allocations
My philosophy: unnecessary memory allocations are the root of all evil in videogames and should be limited to loading screens. Surely, it is like a new year every-day-going-to-gim commitment which you end up breaking the second day, but let us not blind ourselves: we need to pay real attention to it and be aware of their consequences. Basically, when you allocate memory, you are increasing the chance of triggering a garbage collection process that will block all threads—including rendering— until done. By increasing the chances I mean going faster towards the GC process, meaning as well that those framerate hiccups will happen more often. The rendering thread is included in that list, causing that your player will sit waiting in front of a frozen screen for half a second. Didn’t it ever happen to you while playing a FPS game that you’re aiming for the perfect headshot and suddenly the screen freezes for a few milliseconds and in the next frame you appear dead? I have seen many broken unguilty keyboards for that reason. When that happens often enough, you will increase people’s frustration to an unbearable level causing them to throw their phone against a wall so they have a rational reason for purchasing a new, more capable one. They might think that their phone is crap; although we both know our little secret—that we are responsible for that—. Back to our topic, how may we improve and therefore reduce memory allocations?
In my opinion, the most noticeable points to think about are:
- Don’t use LINQ, especially on a per-frame basis. They generate a lot of allocations internally.
- Don’t use foreach in per-frame operations, since they internally generate enumerators that create garbage.
- Avoid using GameObject.Instantiate in-game. Instead, use an object pool system such as EZ Object Poolsand pre-instantiate all the objects you can during loading screens.
- Be careful with coroutines: StartCoroutine is expensive, especially if you use the string overload variant. It is often better to let it run always with a bool check than instantiating and stopping it frequently.
- Also, cache all the yield operations you can so you don’t create much garbage, since a new WaitForSeconds()in every frame will create tons of garbage. Create the yield object once, return it as frequently you want. Replace new WaitUntilEndOfFrame with a return null (and not return 0, which also creates garbage through boxing) if possible.
- If you are using lists, try caching them with static variables instead of recreating them for every usage (per object, in functions, etc.). Also, set the initial capacity if you know it beforehand.
- Try using the stack, therefore avoiding the heap (i.e. struct instead of classes).
- In general, avoid using the new keyword unless while in loading screens.
- Be careful with boxing/unboxing. Value types will automagically and implicitly converted into objects if you treat them as such, creating garbage in the way.
- If you are really serious (and desperate enough) into allocating memory in the stack to reduce the GC pressure, have a look at the C# stackalloc and unsafe keywords.
- As always, check the Unity Profiler for memory allocations. They are especially harmful when done in updates. I recommend using Profiler.BeginSample and Profiler.EndSample to delimit areas of code you want to analyze and also enabling deep profiling. If deep profiling reacts too slow in your huge project, have a look at this tool for exporting specific frames to html.
There are surely good references on the internet about garbage collection, one of them coming from Unity itself.
Unity Materials
We still need a per-platform material management system from Unity. There’s no good solution for dealing with this issue yet, even though it is definitely a very important topic. It is wise to find a workaround until Unity works on that. As mentioned in other section, I created a prebuild step that changes _desktop material references to their * _mobile* counterparts in every prefab found in the project; that works for games that are heavily based on dynamic instantiation of prefabs. But in any case, there are some points you should always consider.
After building you should always, and I mean always, check what exactly has been included in it. The reason is: you might be including huge textures or very complex shaders in a mobile build that will slow down the loading times, increase power consumption and build size, etc.. I suggest a few plugins for that: BuildReport, A+ Asset Explorer, FindReferences2. The first two plugins will help you detecting what your build spit out: texture information (sizes, compression format, dimensions), audio information (size, compression), shaders, materials, etc.. The last of the aforementioned plugins will help you getting rid of materials/textures/shaders that you don’t want in your build. Since you don’t always know where they have been referenced, that plugin helps you finding its source so you can unlink it. Often, materials are less important than their linked resources such as textures.
Unity Textures
Textures are, along meshes and their respective materials, a fundamental pillar of real-time rendering and therefore special consideration has to be taken. There are important factors to take into account, such as compression, texture size, screen size, filtering and UV mapping. Let’s start with the compression issue.
Texture compression is of uttermost importance on mobile. Not only will it reduce your APK/IPA size—important for distribution— but also will improve performance by reducing bandwidth requirements. Loading times will be significantly lower as the textures will be stored compressed in persistent memory and RAM—the GPU will uncompress it on the fly with a negligible cost associated to it—. Hence, it becomes a must to research your target devices —more especifically speaking, your reference device— to find out which texture compression formats are supported. In our case, I went for ETC2 in Android (supported on OpenGL ES 3.0 onwards) and PVRTC for iPhone. Luckily enough, ETC2 supports alpha channels in comparison to ETC so no need for split alpha anymore. It is useful to note that if you choose an unsupported compression format, Unity will CPU-convert it to a supported one in run-time, resulting in an increased loading time and possible hiccups but at least the affected textures will be usable; don’t forget to check the log (e.g. logcat) periodically in dev builds to find this kind of issues. As a side note, some people compress textures in DXT5 even for mobile to get a smaller APK size, an idea I don’t agree with. Anyway, try for yourself and don’t fear breaking (some) (dev) builds. Texture compression is only a piece of the cake, we still have more factors that come to play in performance.
Texture size is something you have to experiment with. Like a lot. It largely depends on the screen sizes and resolutions you will be running your game in. Start with a reasonable small size and increase it in baby steps until it looks well enough, being aware of the fact that the way a texture looks in an object heavily depends on the screen projection and the number of texels visible in screen during the worst case scenario—that is, when the object’s surface occupies the whole screen—. In general terms, the more screen space it can occupy, the bigger the texture should be not to show apparent signs of low resolution; however, the trade-off is that bigger textures will decrease performance and increase the distribution size, which is a factor publishers do really care about as it may prevent your game to be downloaded through 3G/4G. Texture filtering does also play a role in performance.
I have come across many game developers who do not pay the degree of attention needed to texture filtering. I was one of them. In general it is enough to have bilinear filtering. If we are using tiled textures that are not displayed parallely to the screen, you should consider trilinear filtering so as to filter between mipmap levels. Mipmapping is especially interesting for dynamic objects whose display size (in screen) changes over time so as to dynamically choose the right texture size. One can save memory bandwidth and processing power this way. Still, mipmapping will take 33% more memory. Typical use cases for mipmapping: floor, ceiling, walls with tiled textures. UI normally shouldn’t have mipmapping enabled since one pixel will often equal one texel (unless it is world-space or it is rescaled in a way that alters the rule that one pixel is one texel).
Unity Shaders
Shaders have been a big step in the real-time graphics history introduced with the programmable pipeline. Everyone talks about how cool they are and how much flexibility you get by using them, but a less considerable amount of developers care about their impact, especially in mobile development. One will have to maintain them over all platforms so don’t be too generous writing them or you will find yourself secretly making over-hours fixing them.
That said, let’s check some hints not to lose much performance in mobile:
- Avoid standard shaders; better to use Lambert or Phong (mobile diffuse/specular) lighting models than PBR ones. This is especially important when that object takes a big portion of the total screen size, since per-pixel lighting is way more complex in PBR models.
- Since mobile platforms only support forward rendering most of the times, avoid having more than one light in the scene, as every light source will generate an additional pass.
- Do not use GrabPass, since that breaks parallelism and hugely increases the bandwidth requirements (that mobile platforms lack). For that very reason, avoid post-effects on mobile.
- Use unlit and fake lighting effects through tint colors, when possible. Getting rid of lighting calculations will help tremendously.
- Disable fog if not needed.
- Disable shadows support, if not needed. Consider baking shadows into textures. Avoid using megashaders and big shaders, since the compile times will increase your application startup times (some shaders I saw took 5 seconds to compile).
Audio
Check the profiler to figure out how much memory they are taking. Normally they should not be a problem, but there might be a few issues:
- If they are taking too much memory, try setting them to streaming.
- If they are increasing loading times you have a few options:
- Set them to load in background; although you risk them playing out of sync the first time you play them. Too bad this setting is shared among all platforms, though..
- Disable preload; however, the user will experience lag the first time they’ll be loaded.
- Set them to streaming. That will increase CPU/IO usage though.
Extra
Camera imposter system
One big challenge is to bring high-end graphics to mobile. Mobile platforms simply do not have the capability to render such quality in real-time. One solution lies on the sentence I just wrote: let’s render quality pictures only once and display that static picture in every frame of our run-time application.
The basic idea is to render a specific camera content into a RenderTexture during the Awake function. That camera has a carefully selected culling mask set to the Prerender layer so only those objects would be rendered; afterwards those objects will be disabled. The camera component is to be disabled, so automatic rendering will not happen but only when manually triggered with camera. Render(). A rough process description follows:
- We create a camera with the same settings as the main one, setting its culling mask to the Prerender layer and two levels lower of depth. We remove that culling mask from the main one. We may add our breath-taking post effects in the imposter one.
- We move the high-quality geometry we want to prerender to the Prerender layer (adjust lighting if needed).
- We create a script for the prerender camera that executes the following:
- On Awake, disable the camera component and create a RenderTexture with the screen size, ARGB32 and 24bits depth formats.
- In the next frame, set the target texture to the aforementioned RT and call camera.Render() only once.
- Disable the 3d static geometry belonging to that layer.
- We create a second camera in the scene with same settings, one depth lower as the main one and culling mask set to none with a script that does the following:
- Get a reference to the RenderTexture created and rendered in Prerender camera.
- Render that RT in OnRenderImage using Graphics.Blit
- Then, set the main camera to not clear any flag so it renders all the 3d real-time geometry on top of the RT we just used.
There are multiple advantages of such a technique: it does not only improve the framerate and saves energy but it also allows you to run expensive image effects. It is quite limited as it is highly static: neither your camera nor the target objects should move or change.
I was happy. But also naive. After some hype I noticed something odd on the screen: a few objects that were supposed to be occluded weren’t. I didn’t expect that so after grabbing a strong black coffee I loaded RenderDoc up and discovered that my blit operation was just writing the color buffer and not the depth information. But why? The depth information was in the render texture. Sure, it might be skipped to save resources as users don’t deal with such a scenario so often, but there must be a way to write the depth information from the RT into the frame buffer, right? No there is no function for that. Only workarounds.
I spent a whole day trying to access the RenderTexture’s depth buffer with no luck. My self-assigned timebox expired and I decided to go for a not-so-elegant solution: render the scene a second time with a different shader that takes the camera depth, converts it to a Float color and is saved to a second RT. That second RT containing the color-encoded depth information will be Blitted after the colored one with a custom material that converts the color to a depth value and writes to the depth buffer in the fragment shader. So, after this, I could use the system everywhere with depth buffer information which improved its flexibility.
So much bla bla, so let’s get to the point. By prerendering the static geometry I was able to turn on all image effects, use complex shaders and max quality shadows for nearly free and I still got +8 FPS. I faked illumination on some objects by using a custom colored unlit shader that changes over time and I was ready to go.
Plugins
- Build ReporterA must have for listing the assets that are being included in the deployed application (APK, IPA). It makes the task of assets down-stripping much easier. I would suggest you to automatize this process in your build pipeline to detect wrong assets or possible issues introduced in the development process.
- FindReferences2Whenever you want to find the references to a specific entity (textures, sounds, materials) to decide if some changes are feasible you will have hard times getting them, especially if you use prefabs that are instantiated dynamically. This plugin makes the task much easier. It is especially helpful when tracking down shaders that aren’t suppose to land in a build, as they could be really expensive to compile (order of seconds).Let’s say you have a texture and you want to know where it is used in order to judge, for instance, if a change in its resolution is feasible. The naive way is to right-click on the texture in the project window and select “find references in scene”. This works in a very limited way: it checks only in the current scene and if you are using prefabs that will be instantiated in runtime, it will work only if they are flat. Let me elaborate the last point. Let us say we instantiate a Player prefab in runtime. For that, we hold a reference to it from somewhere in the scene. If the prefab’s GameObject directly contains a reference to the texture, then it will be indirectly found by Unity. If that texture is, however, used in a child component, then it will not.
Also, many projects use lots of scenes, so it can be very tedious to search for references. An issue I had in Catan Universe was searching where a very complicated shader (thought for high-end PC) was being included from for mobile builds. With such a plugin I just had to select the shader and I directly found who was actually guilty. - A+ Asset ManagerIt lets you find items in your project through many different filters. You can, for example, filter and sort by texture size, compression, size, etc.. It helps considerably when optimizing assets for specific platforms. - Hdg Remote DebugThis plugin will let you remotely analyze the hierarchy of a running project. It comes handy to find bottlenecks, as you may do AB testing by disable objects individually to see where the frame-rate (or memory) dramatically increases. - EZ Object Pools Small free tool to pool objects that you want to pre-instantiate.
Tools
Sorted by importance:
- Unity profiler: especially useful for CPU profiling (scripts).
- RenderDoc: incredibly useful for checking the approximate timings of draw events (including draw calls).
- Snapdragon profiler: it helps debugging frames and system-wide performance metrics (the process specific ones are quite limited). You can also inspect textures and shaders.
- Adreno profiler: it offers different performance metrics. It is however obsolete and has been replaced by snapdragon profiler. Many features are heavily platform-dependent.
- App tune-up kit: by installing it in your phone it’ll allow you to open applications and measure its performance to gather some interesting statistics and suggestions. It will also compare your application to a database of known applications.
Conclusion
Consider performance from the beginning; just don’t get obsessed with it. I highly suggest working hard on a build pipeline that allows you to run real-time automated performance tests on your target devices. Such a system should log its results in a remote backend like ELK so you can calculate statistics over time and detect anomalies. I am currently setting this up for my next project: Diamond Dash Unity. I might make a blog post covering the techniques I adopted for achieving it. That said, I hope this entry offered you some value. Stay tuned.

Get the Unity Performance Checklist
Sign up to access the checklist and companion resources in your members area.

