Your frame-time graph looks fine… until Tilemaps instantiate, audio spins up, or URP "records" the frame.
That “one hitch” is why retention drops and reviews go 4.6 → 3.9.
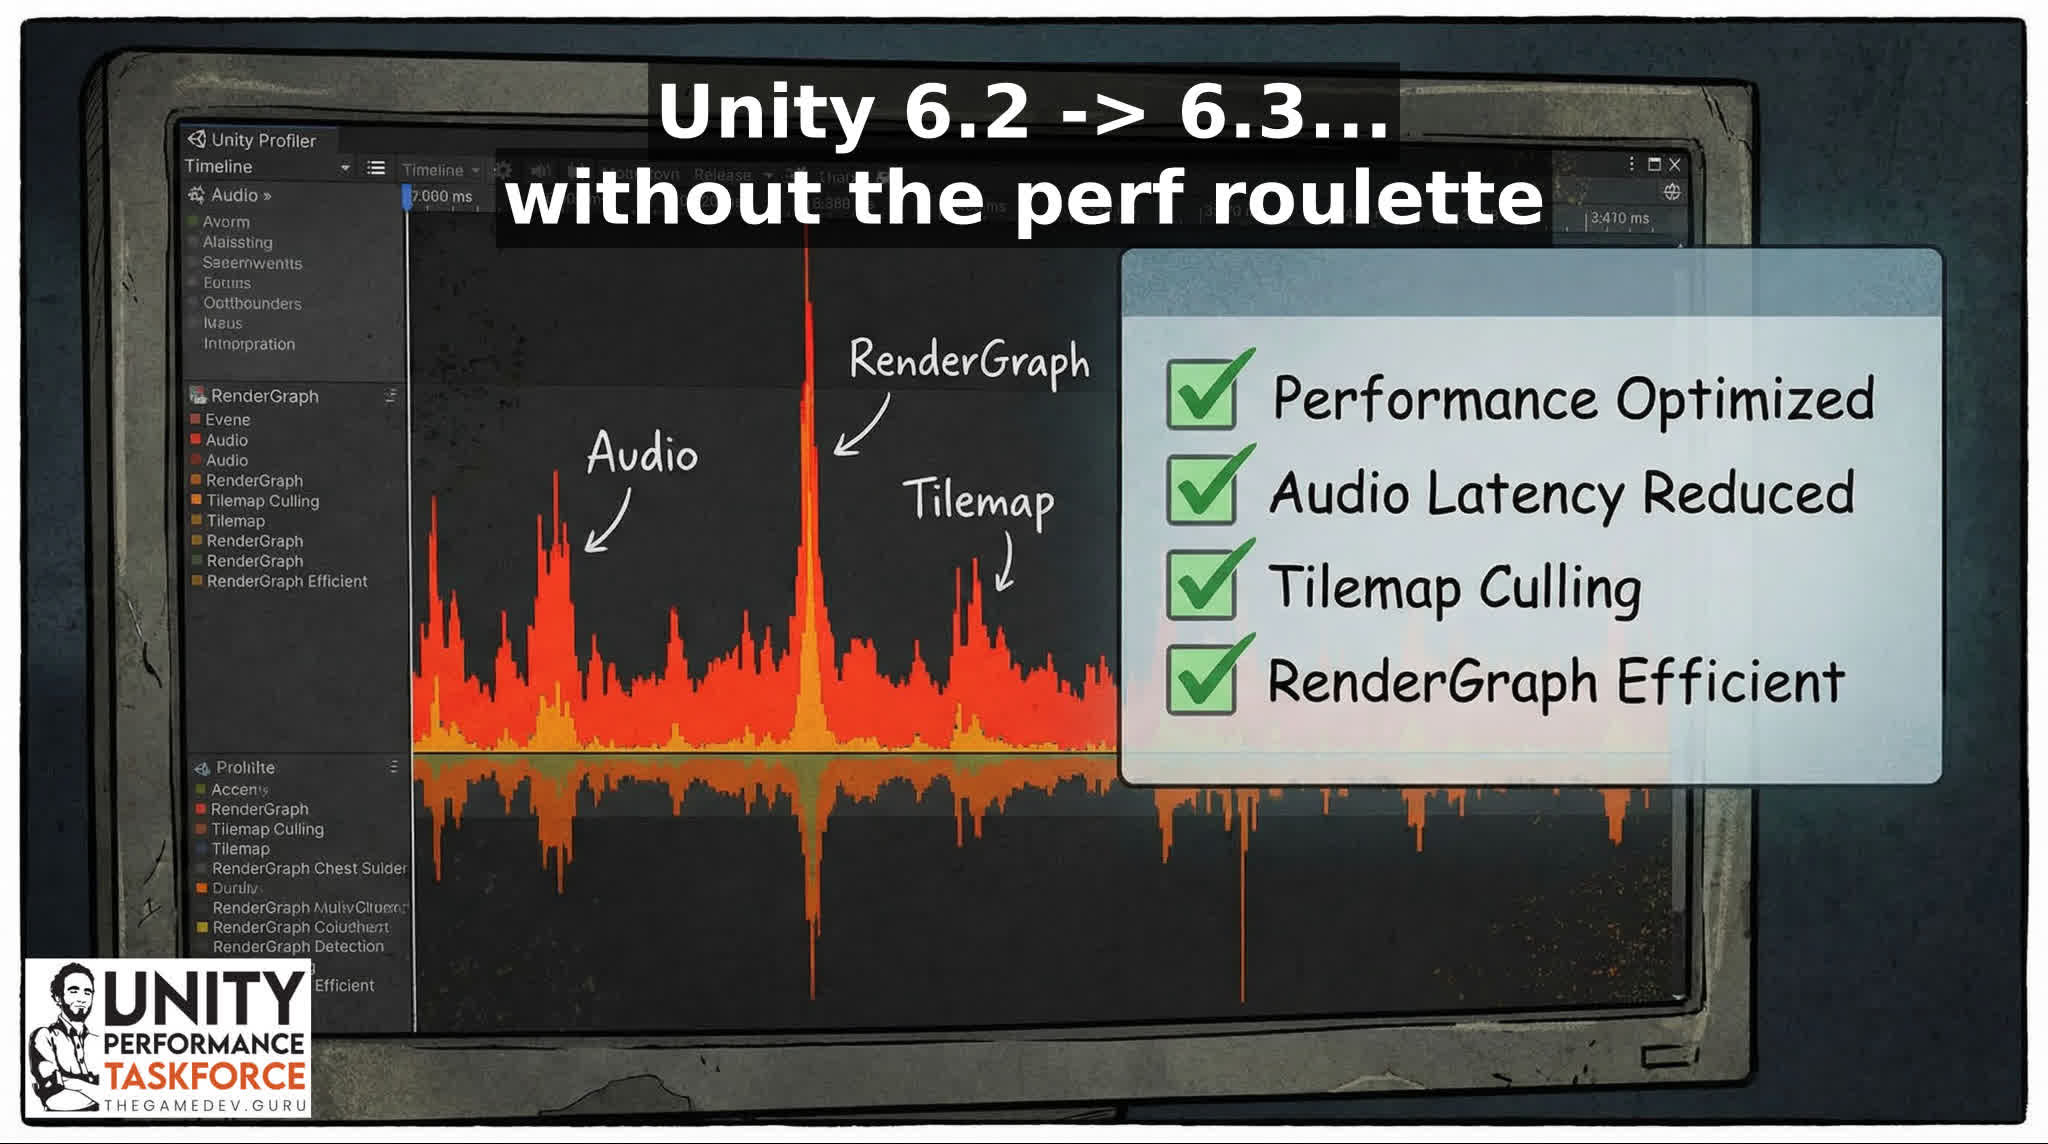
Here’s what Unity 6.3 (6000.3.x) changes that can reduce hitches, memory pressure, and iteration time compared to 6.2.
Summary
- Faster Burst+IL2CPP player builds (~22% in some workflows).
- Less main-thread hitch risk from audio work moving off-thread.
- Render Graph CPU recording can be 2–4% faster in scenarios.
- Lower memory pressure paths (AssetBundles, platform allocators).
CEO/Producer translation: fewer spikes + faster iteration = higher retention, better reviews, and cheaper UA.
Quick win (2 minutes)
- Pick 1 benchmark scene + 1 target device, then capture a baseline BEFORE upgrading.
- After upgrading, compare frame-time stability (spikes), not just average frame times / FPS.
- If you hit weirdness, rollback fast—don’t debug blind for a week.
Top 5 upgrade reasons (Unity 6.2 → 6.3)
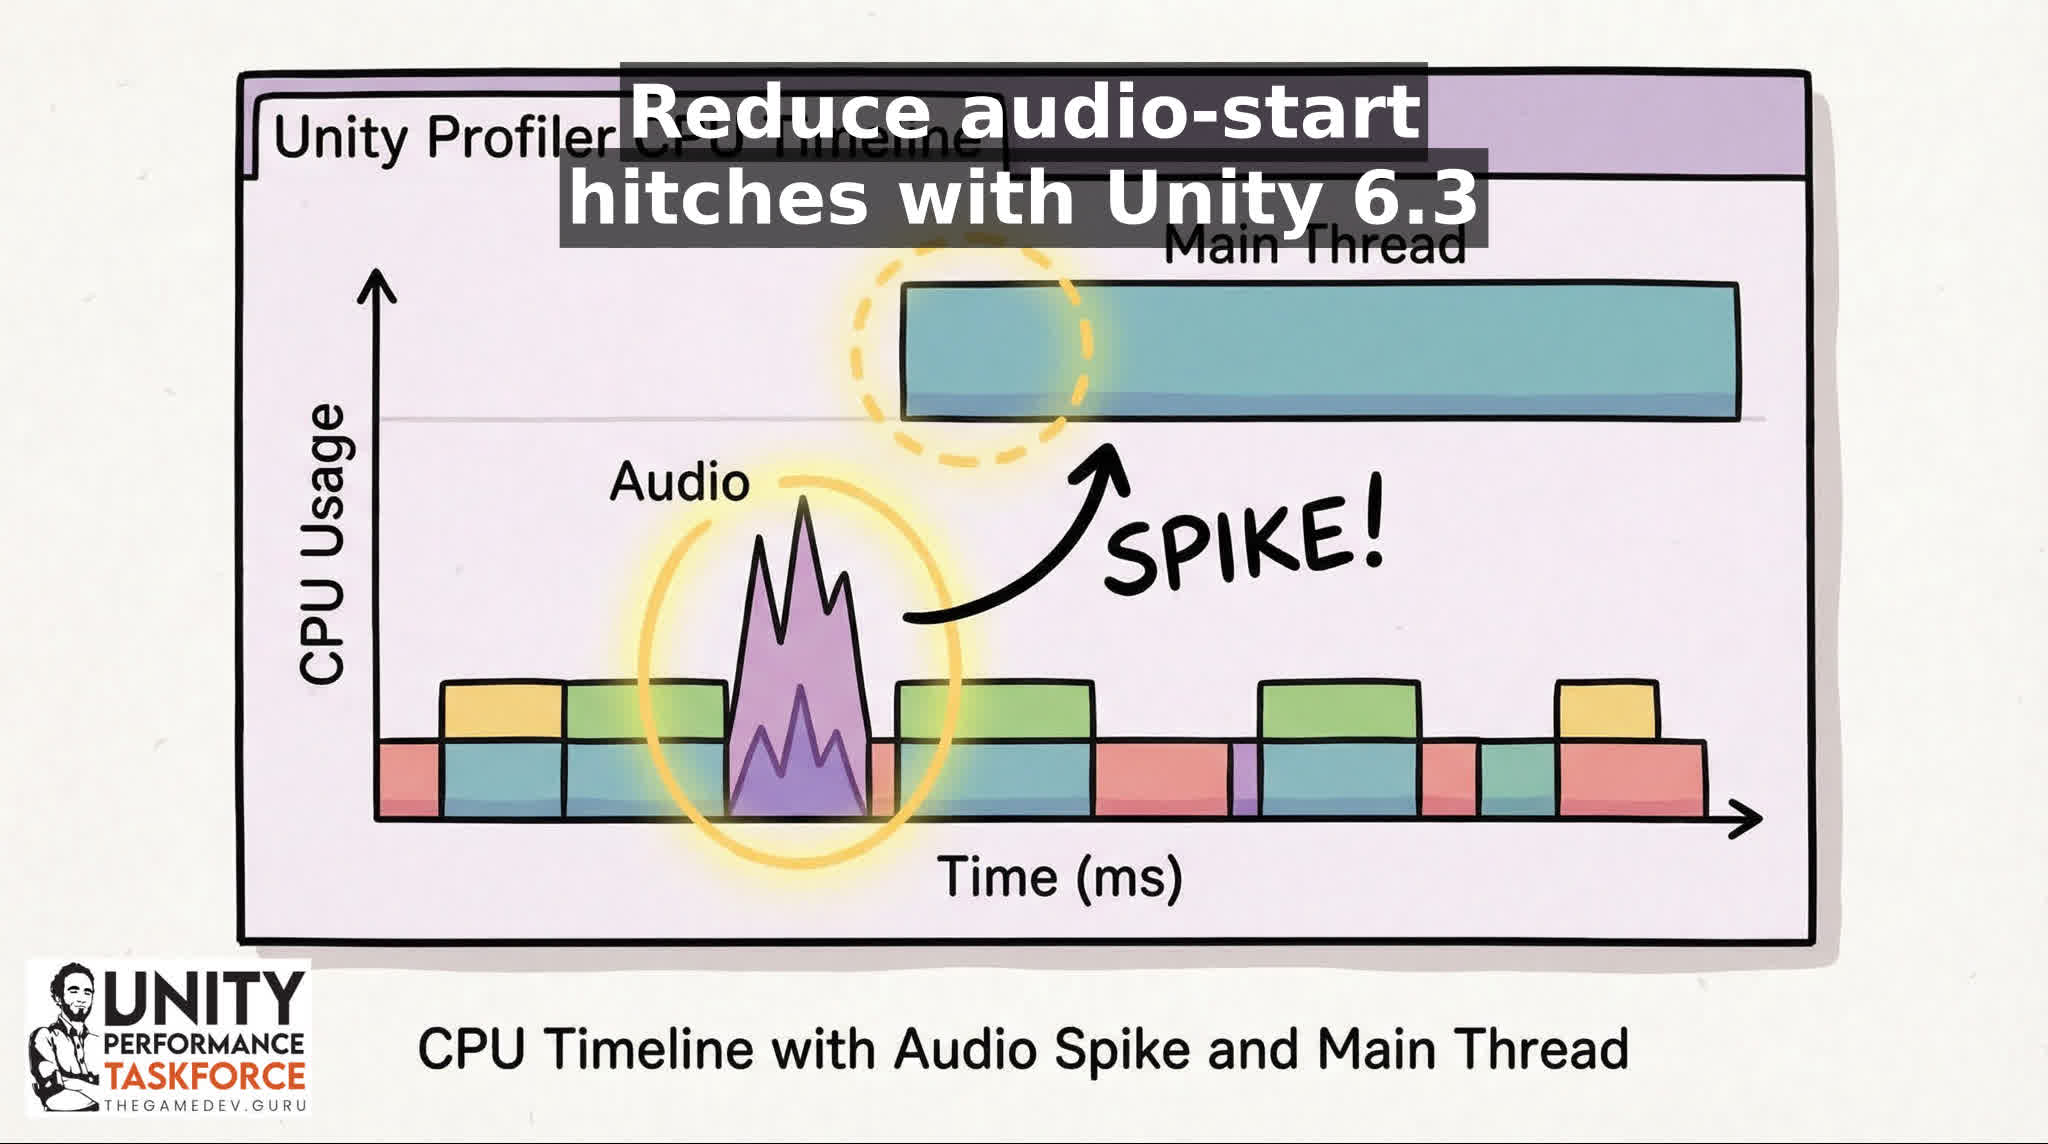
1) Enhanced audio foundation (Enhanced mode): expensive platform audio operations moved off the main thread to reduce main-thread hitches.
- Why it matters: fewer “random” audio-triggered stalls that feel like stutter.
- We move expensive platform ops off the main thread.
- Do this next: in a Development Build, reproduce your worst hitch moment and confirm the spike shifts/shrinks on the main thread.
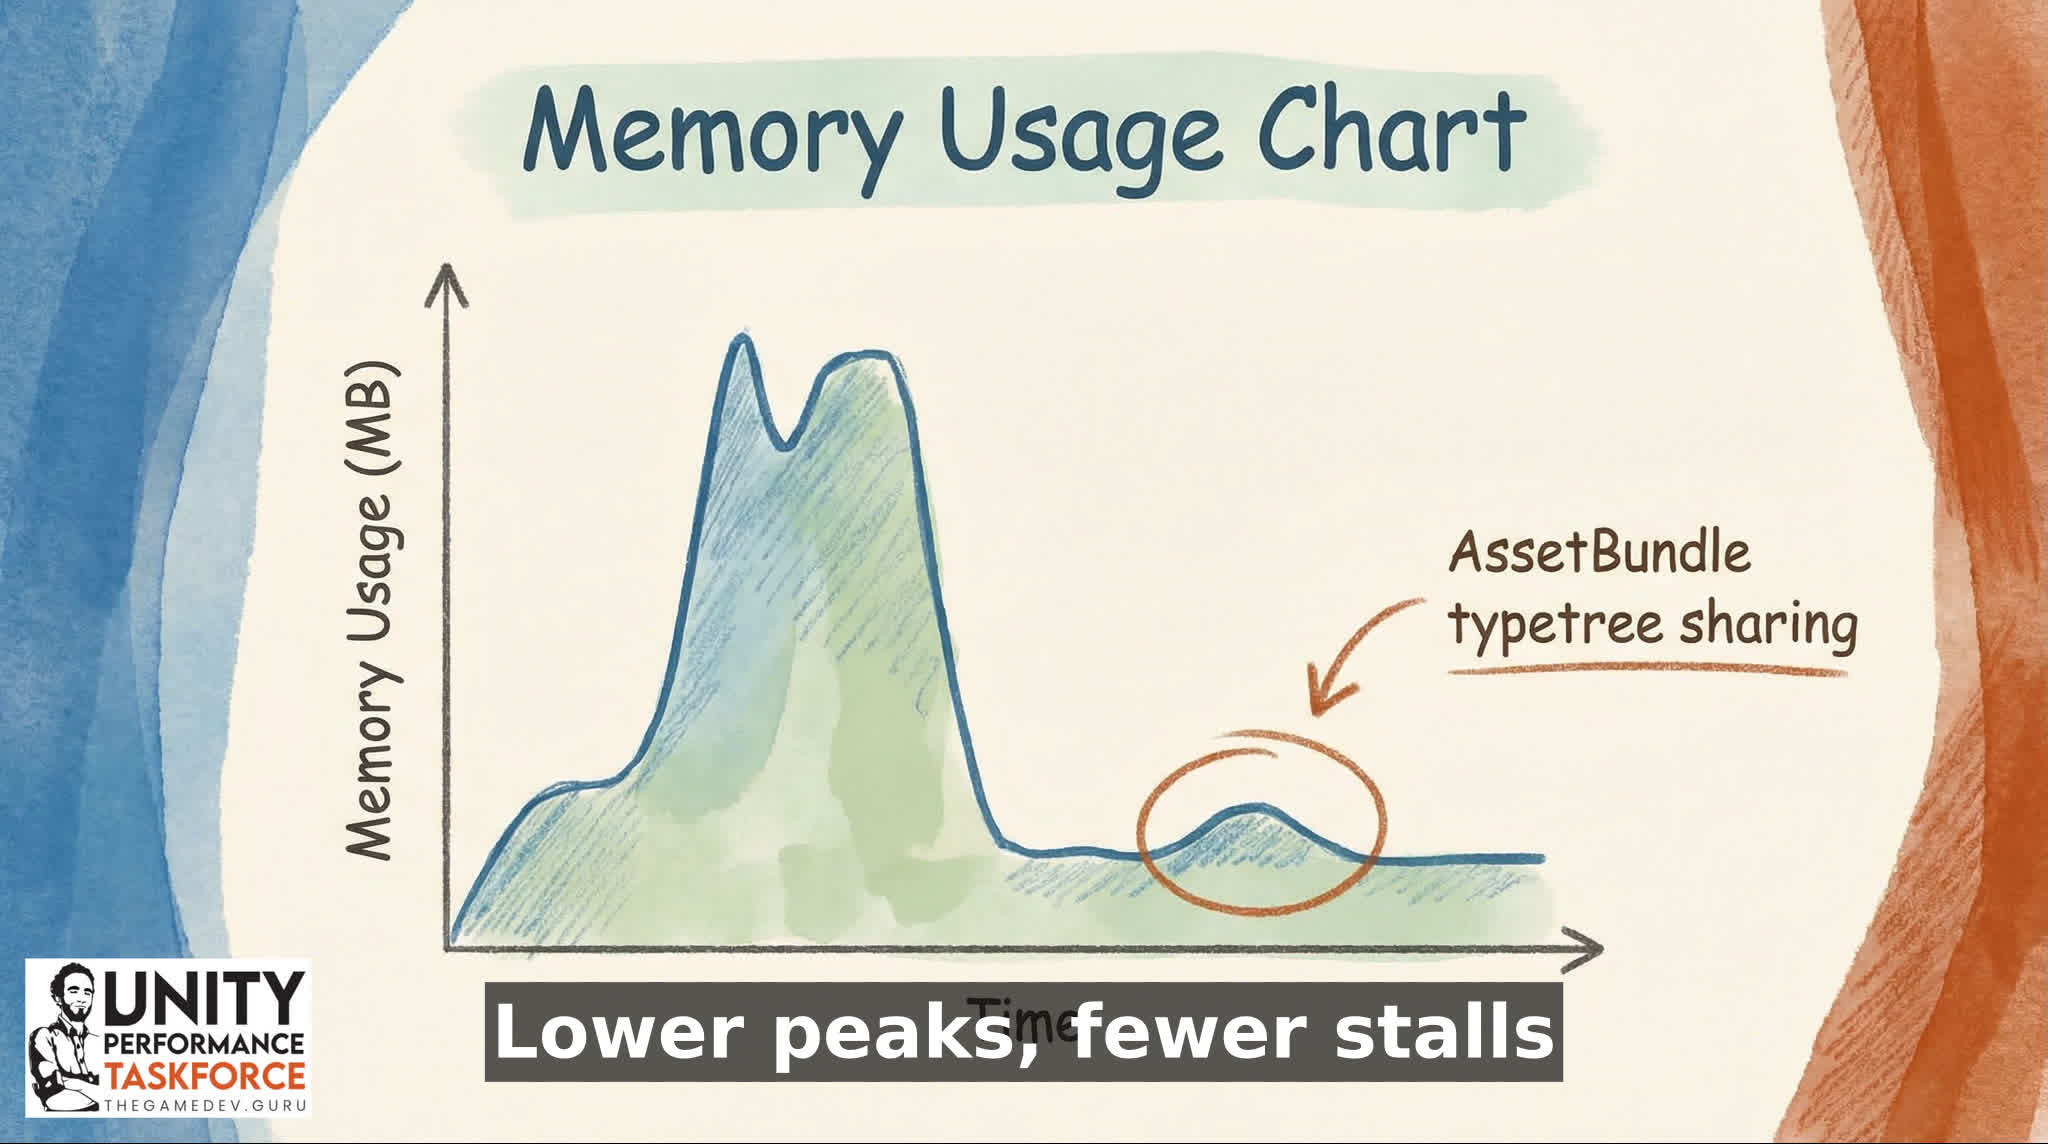
2) Reduced memory usage from loaded AssetBundles by sharing duplicated typetrees.
- Why it matters: less memory pressure (and fewer knock-on spikes) when you’re streaming lots of content.
- The change is specifically about reducing memory used by loaded bundles.
- Do this next: log memory before/after your biggest content load, and watch if peak usage drops.
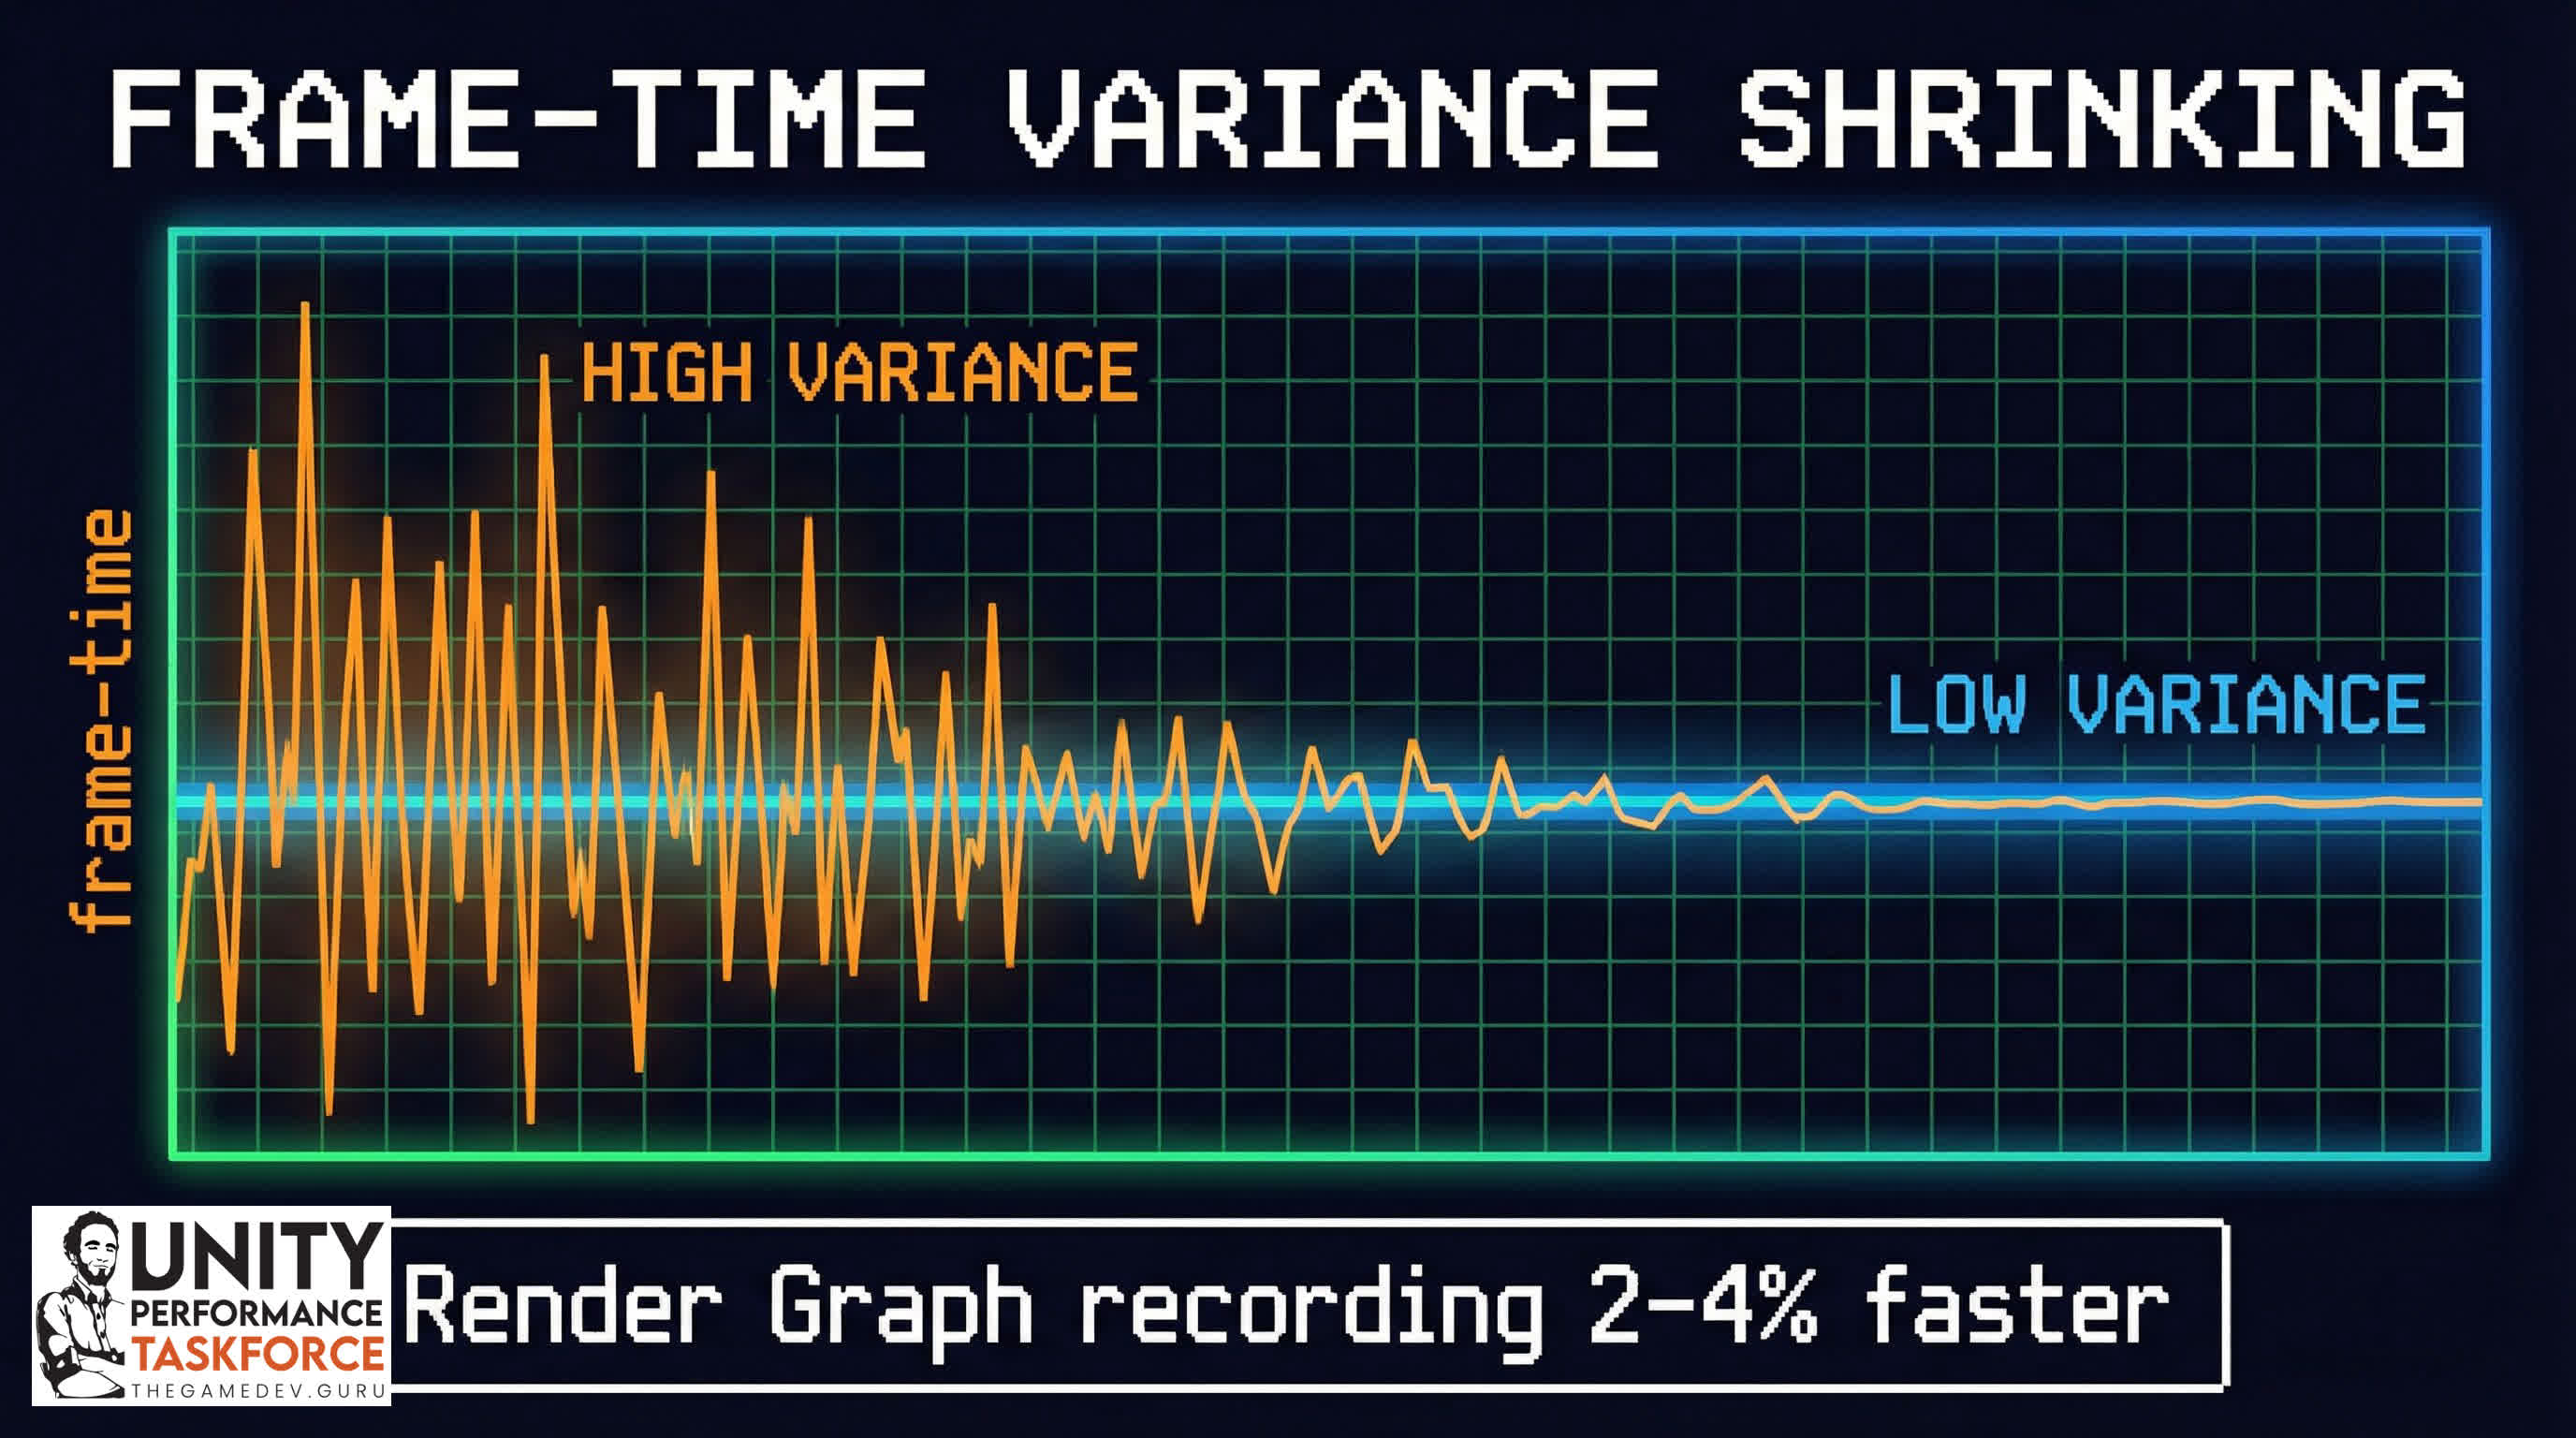
3) Render Graph recording step now 2–4% faster on the main CPU thread in several scenarios.
- Why it matters: small % wins on the main thread add up when you’re already close to budget.
- Unity reports the 2–4% speedup (scenario-dependent).
- Do this next: capture CPU timeline in your benchmark scene and compare main thread time before/after.
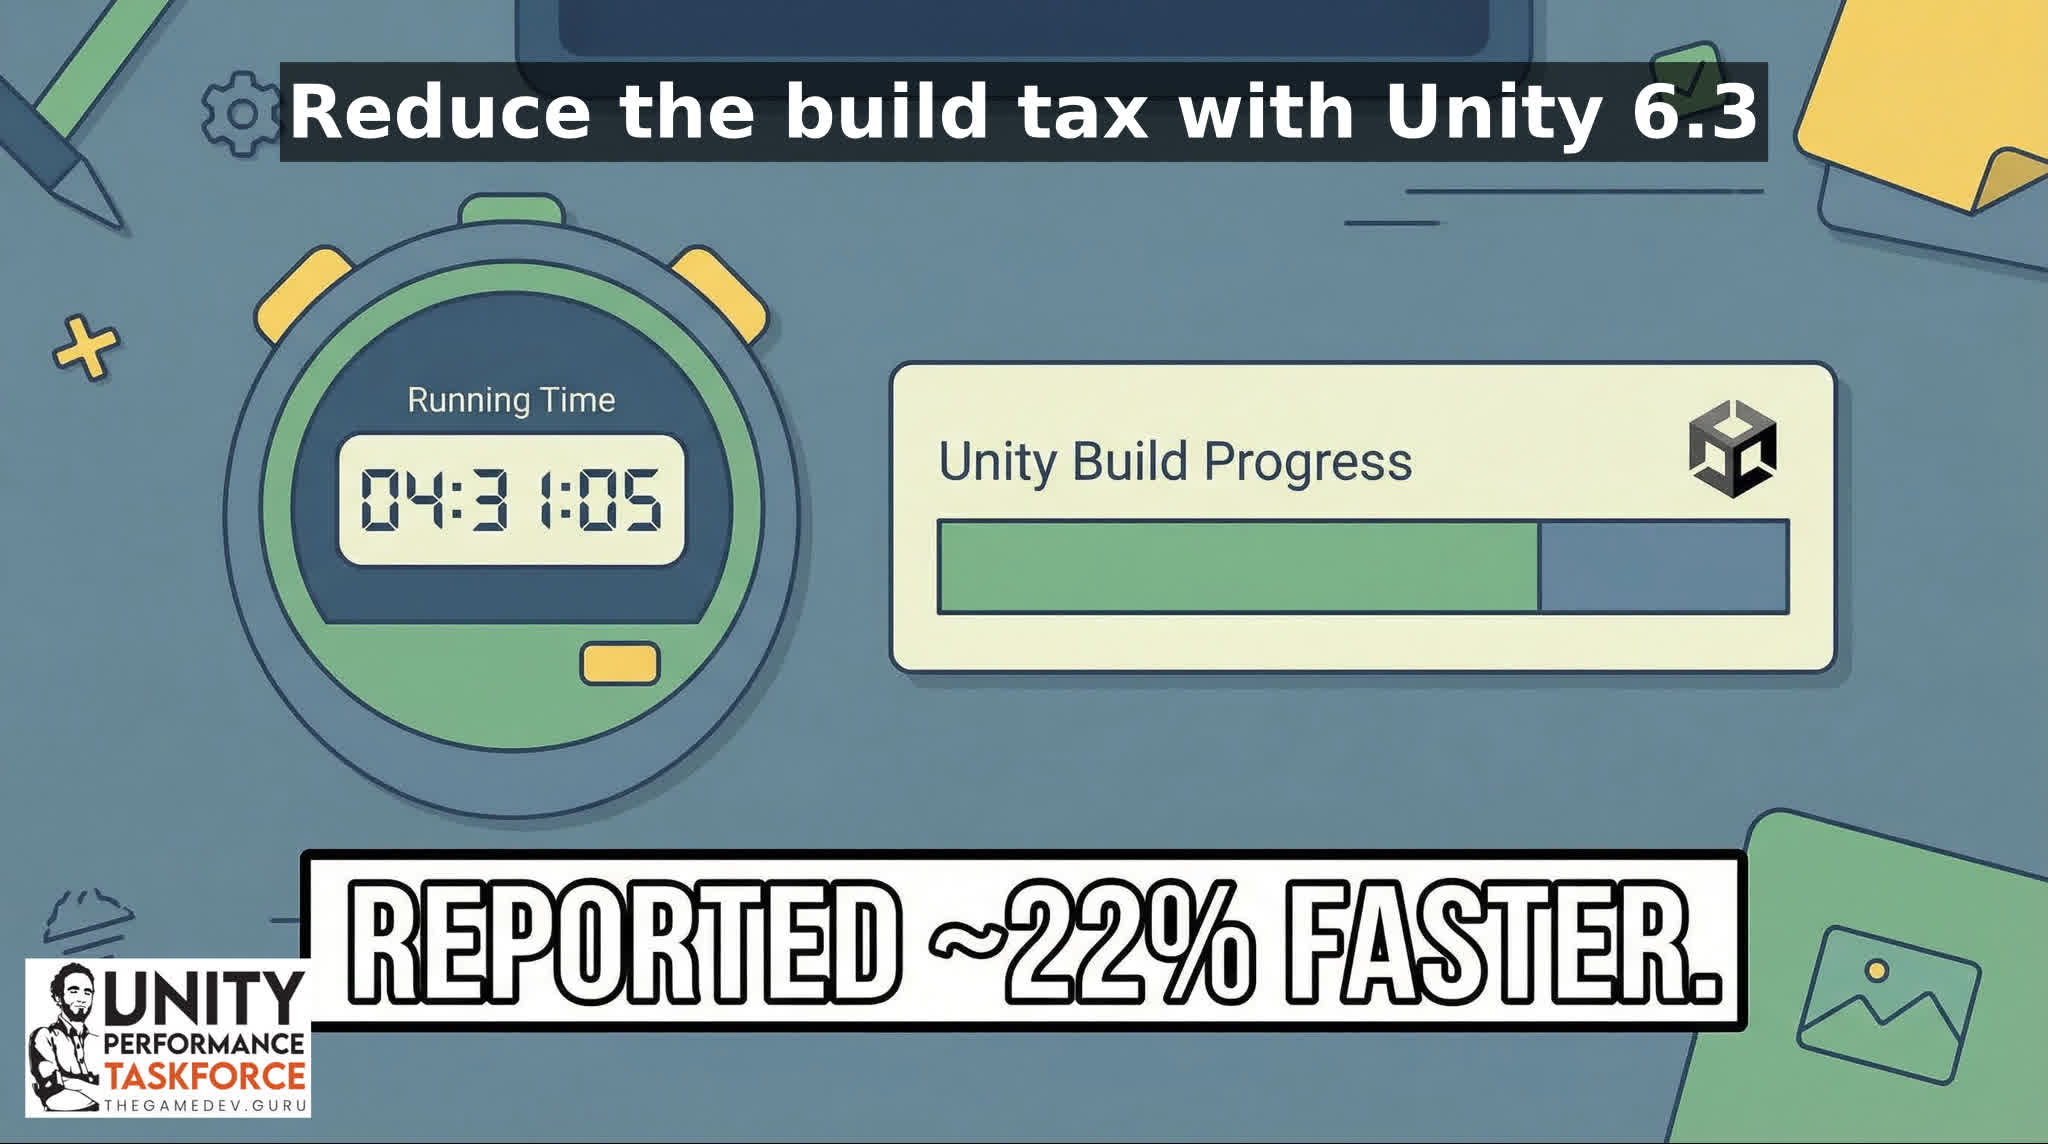
4) Improve player build times when both Burst and IL2CPP are involved (reported ~22% reduction in some workflows).
- Why it matters: iteration speed is a performance feature for your team—more tests per day, fewer late surprises.
- Unity reports ~22% reduction in some workflows (your mileage may vary).
- Do this next: time 3 builds before, 3 builds after (same machine, same options), average the results.
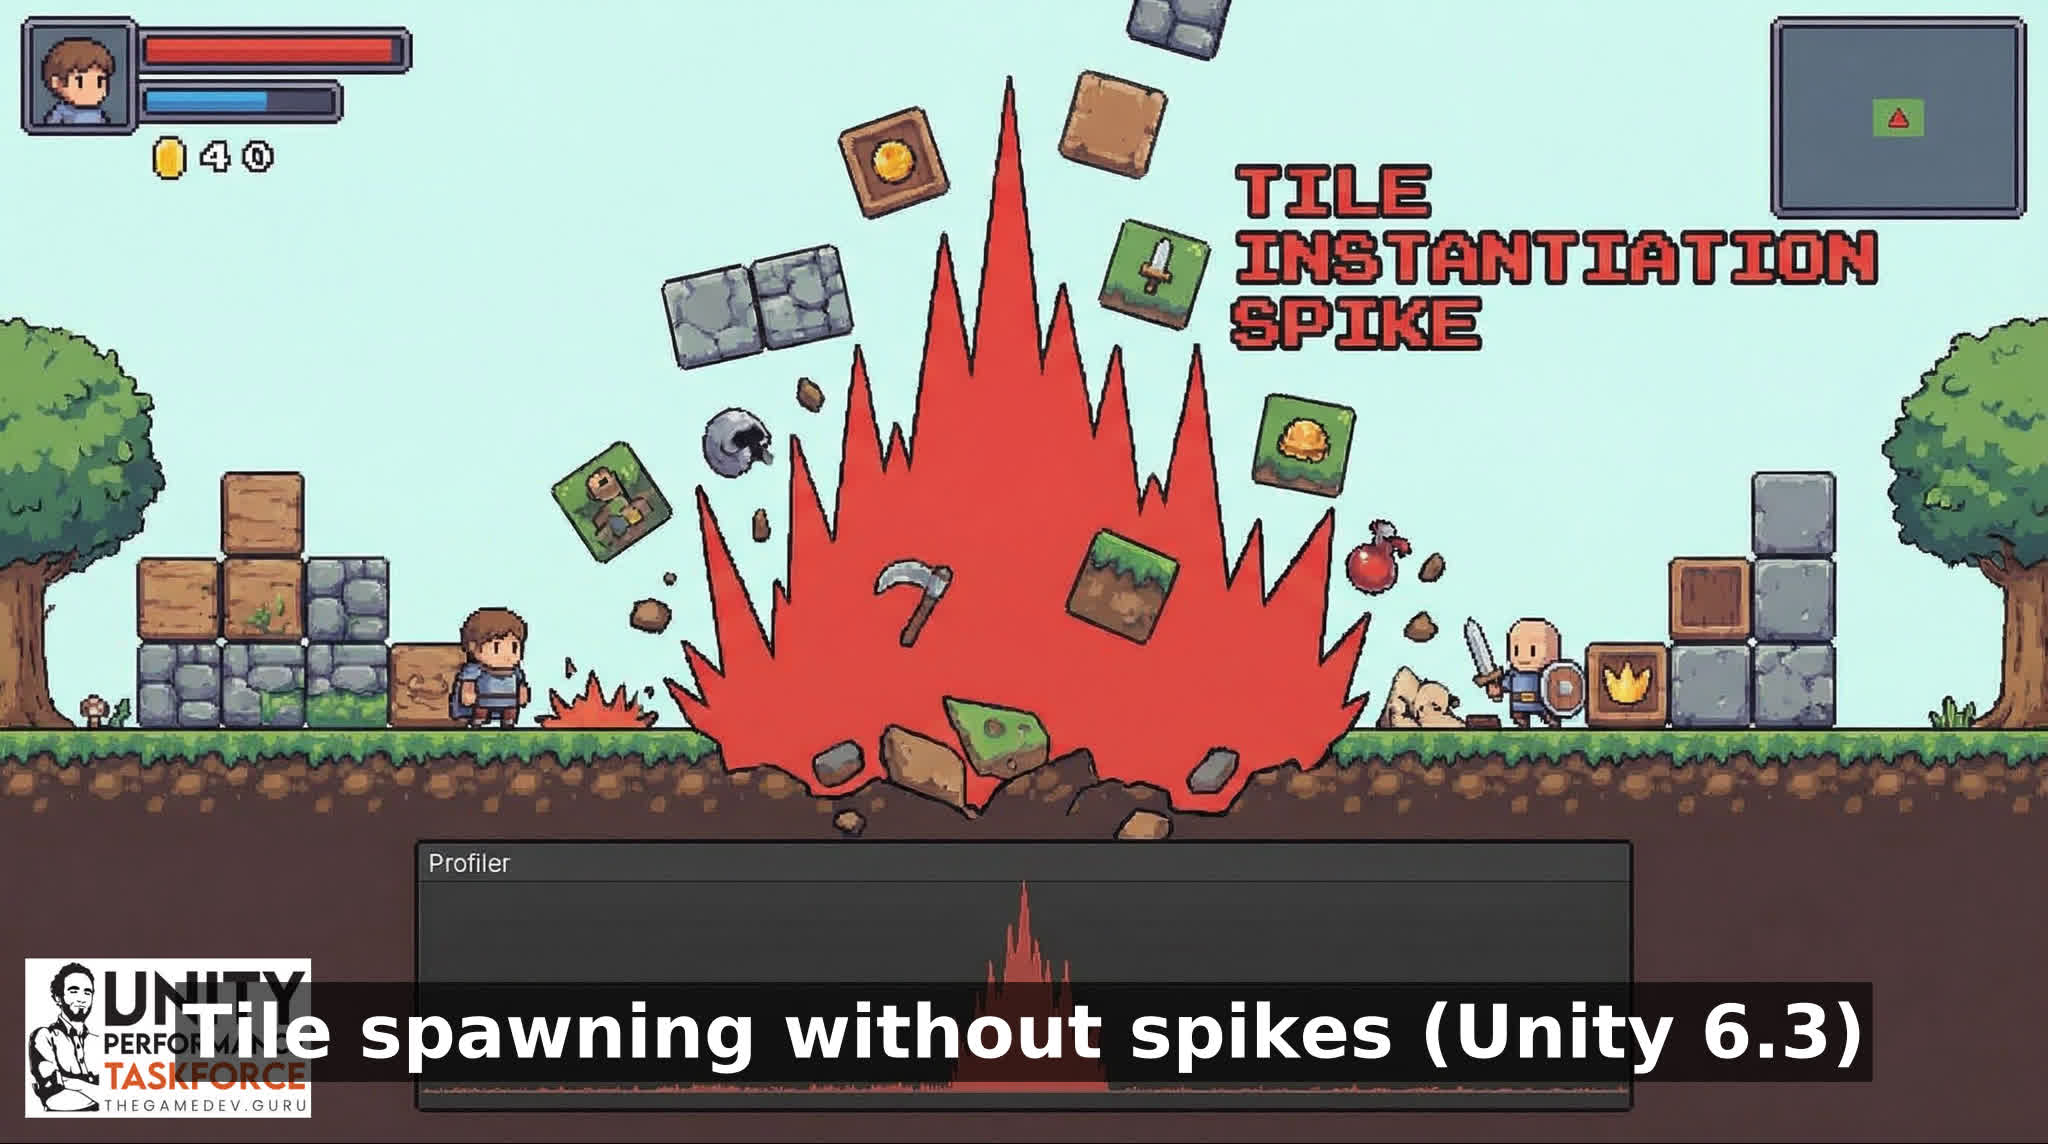
5) Improved performance of instantiation of GameObjects from Tiles
- Why it matters: if your 2D game spawns from Tilemaps (or does runtime edits), this can be a spike killer.
- Do this next: reproduce your worst Tilemap spawn moment and confirm the spike shrinks (and stays shrunk).
Simple upgrade smoke test
- Lock one benchmark scene + one target device tier.
- Record baseline: CPU timeline + GPU (if available) + memory peak during your worst hitch.
- Upgrade → rebuild → re-record the same actions.
- Only then decide: keep, rollback, or patch forward.
Other notable fixes (and landmines)
- SpriteAtlas previews can now be packed and previewed asynchronously, preventing Editor freezes during these operations.
- Reduced memory overhead for Vulkan command buffers when using graphics jobs.
- Fixed rare deadlock scenario in AsyncResourceUploadBlocking() when loading resources (typically Textures) from AssetBundles.
- Known issue: 100% crash rate when loading two profiler captures in the Profile Analyzer compare tool
- Known issue: Increased CPU usage when moving NavMesh Obstacles with carving enabled
- Known issue: Increased Memory usage when Update Mode 'On Demand' Realtime lights are used and DX12 API is selected
If this upgrade is blocking your release (or you can’t reproduce the perf regression reliably), stop burning a week. Bring a capture and we’ll kill it fast.
Upgrading engine versions is where good schedules go to die: you get a few real wins, a few new regressions, and a team arguing from vibes.
More changes?
- Added profiler markers to PlayableDirector and PlayableOutputs (profiling-oriented) -> better visibility when Playables are part of your spikes.
- Fixed memory spike after activating Freeform Light2Ds.
- Optimized the AddBlitPass utility to use AddCopyPass when applicable -> small render pipeline wins can stack when you’re near budget.
- Fixed excessive rebuilding and resetting of Layout Groups -> UI rebuild storms are a classic source of stutter.
- LowLevelPhysics2D renderer now performs orthographic render culling, significantly improving debug rendering performance in large scenes -> even debug views can wreck editor/runtime experience in big scenes.
Next steps
If you want the fastest path: run the smoke test, grab one capture of your worst spike, and bring it to the Unity Performance Taskforce. Or book a timeboxed diagnostic and we’ll cut straight to the top offenders.