Myth: “If the Unity Editor says I’m GPU‑bound (performance-wise), that’s the full story.”
Reality: GPU‑side timelines reveal work vs wait and pipeline state churn that the Unity Editor can’t.
In the previous post, we covered Player‑Side Smoothness, CapFrameX + PresentMon Percentiles & Overlays, read it here.
Picture your frame as an airport. Draw calls are planes, the GPU is the runway, and pipeline state is the runway configuration. Your flight control tower, Radeon GPU Profiler (RGP), shows which planes are landing, which are circling, and when the runway keeps changing lights and direction.
Players feel slowdowns; Editor tools are vague. You open RGP, the Frame Summary says “CPU‑bound” or not, you see idle time, then drill into Event Timelines and Pipeline State to spot expensive state changes and long GPU waits. Now you can act.
TL;DR
- Start at Frame Summary. Determine CPU‑ vs GPU‑bound and inspect idle time before changing content.
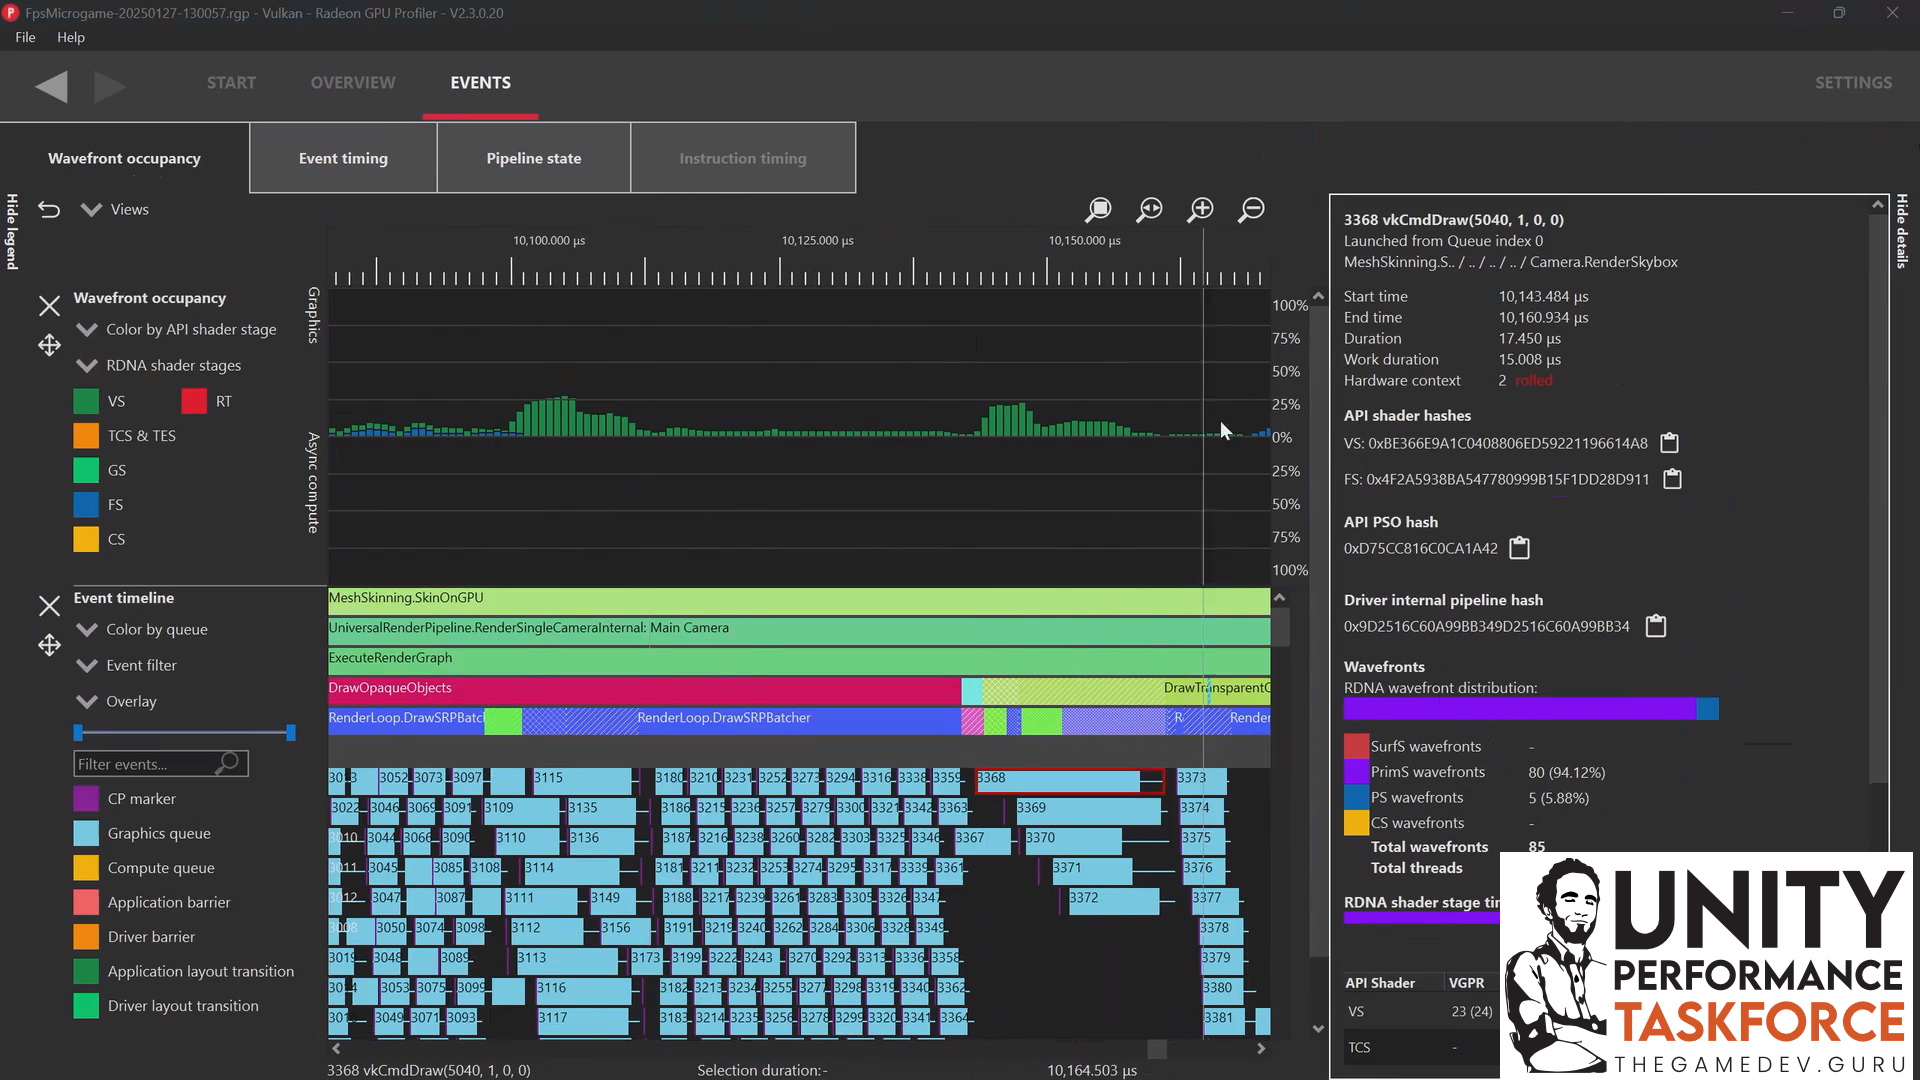
- Compare Duration vs Work Duration. Total time a pass takes vs the time the GPU actually worked.
- Audit pipeline state changes. Frequent/redundant state flips (“context rolls”) make draws expensive.
- Use the event timeline. Identify heavy passes (shadows, prepass, SSAO, opaque, bloom) and who they’re waiting for.
Why this matters
GPU performance bottlenecks in Unity are often scheduling and state problems, not just “too many shaders.”
Radeon GPU Profiler shows exactly what the GPU was doing per event, including when drivers insert barriers and when your pipeline changes force stalls.
Business line: Fixing the real GPU bottleneck improves battery usage and framerate so that your players play and pay for longer.
Mechanics: what Radeon GPU Profiler shows you that Unity does not
It's important to note that RGP is much more focused on the GPU component! After all, Radeon is really about GPUs.
Some highlights:
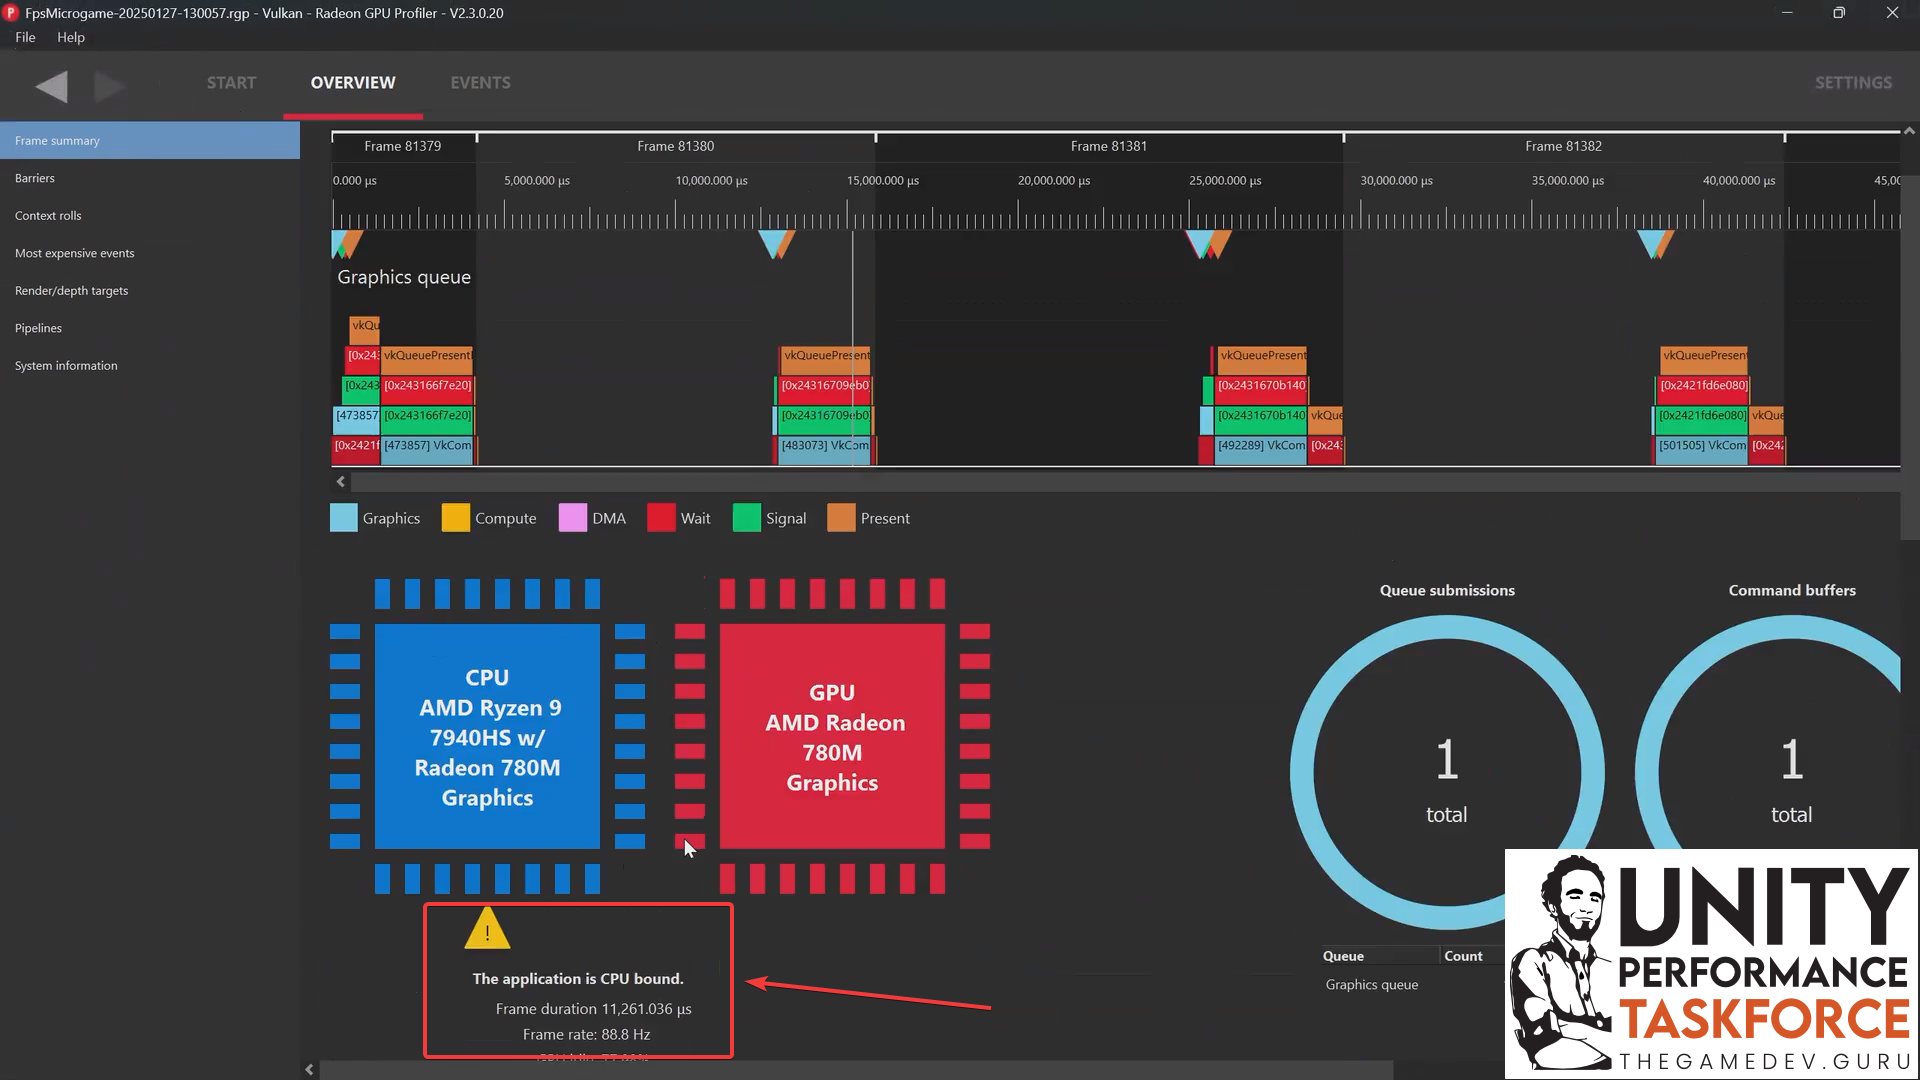
- Boundness at a glance: RGP's frame Summary will tell you if your Unity game performance is CPU or GPU bound
- State churn: Context rolls happen every time that you change the GPU render pipeline state.
- Work vs wait: work duration is the amount of time the GPU actually worked on that.
- Per‑event truth: This tells you what's going on with your GPU per draw call or actually more like event.
RGP organizes this into:
- Frame Summary, CPU/GPU perspective, idle time, queue submissions.
- Event Timeline, chronological GPU events (barriers, clears, draws, dispatches).
- Pipeline State, IA → VS → Rasterizer → Pre‑Fragment → Fragment → Post‑Fragment → Blend (plus Compute).
- Context Rolls, where state flips inflated cost.
- Render Targets, sizes, passes, and time spent writing/reading.
The Blueprint: GPU reality check for Unity builds
Remember to analyze a player build, never the Unity editor.
1) Start at Frame Summary
- Open your capture and check the CPU‑ vs GPU‑bound indicator and GPU idle time.
- If CPU‑bound, verify frame pacing first (see the previous post’s percentile workflow); don’t prematurely “optimize shaders.”
2) Read “Duration” vs “Work Duration”
- For each event/pass, Duration is how long the event spans on the GPU timeline; Work Duration is actual compute/shade time.
- Large gaps between them signal waiting (barriers, resource hazards, queue sync).
3) Hunt state churn (Context Rolls)
- Open Context Rolls and scan which state flips happen most (e.g., shader, depth state, cull mode, blending).
- Redundant changes amplify cost without visual gain. Consolidate materials/passes to reduce flips.
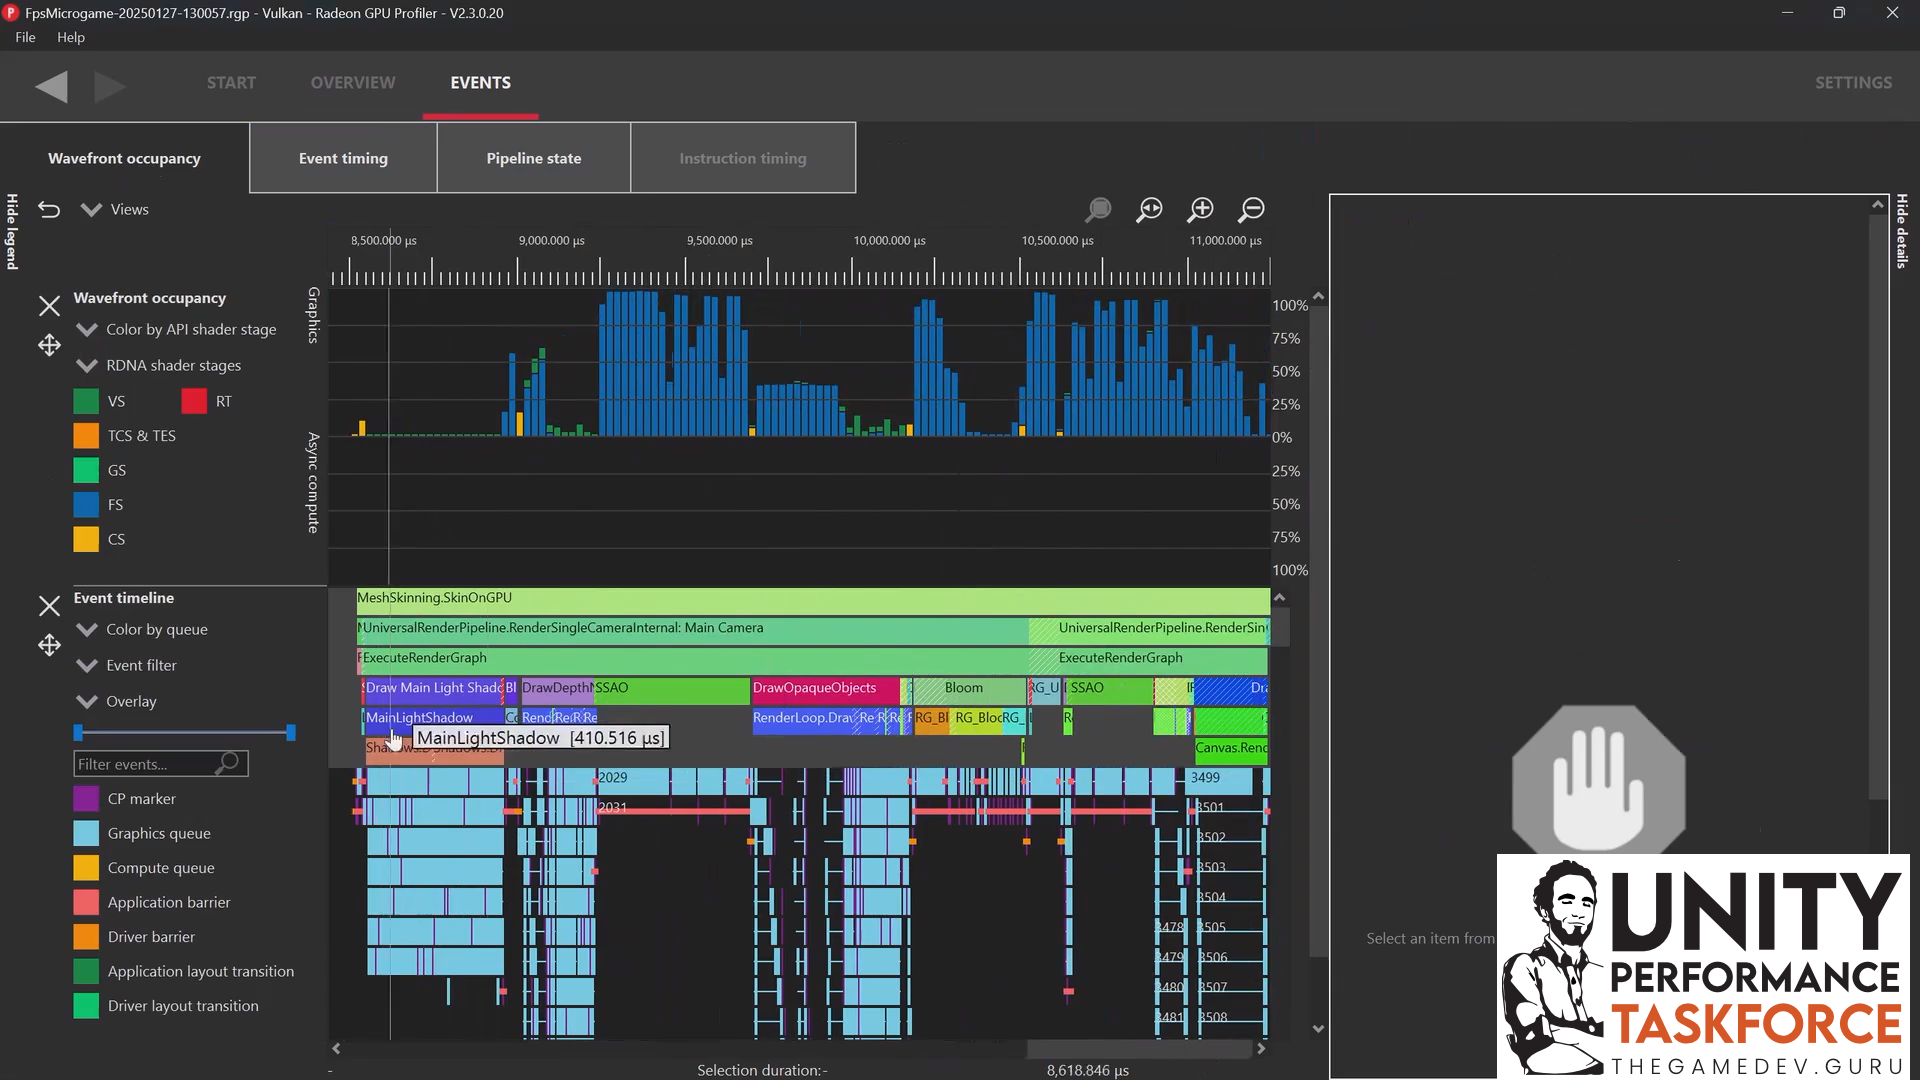
4) Walk the Event Timeline
Typical Unity sequence (varies by pipeline/project):
- Shadow map work
- Prepass (e.g., depth/normal)
- Screen‑space effects (e.g., ambient occlusion)
- Opaque geometry
- Post‑effects (e.g., bloom)
- UI / overlays
Expand events to see neighbors and waits. If a pass repeatedly waits on a barrier, identify the producer pass and re‑order or decouple resources if possible.
5) Inspect Pipeline State
In Pipeline State:
- IA: primitive topology; ensure you’re not pushing pathological micro‑triangles.
- VS: sanity‑check attribute counts and work, precompute where possible.
- Rasterizer: verify culling and viewport/scissor settings are appropriate.
- Pre‑Fragment: depth/stencil test/write configuration, prefer early rejection when possible.
- Fragment: often the bottleneck; heavy textures/branches inflate pressure. Trim material parameter count, simplify branches, and consider cheaper variants.
- Post‑Fragment / Blend: blending off for opaques; on where truly needed.
6) Review Render Targets
- Check the Render Targets panel for target sizes and write/read time.
- Keep targets lean; avoid oversized intermediates. Reuse where it’s safe.
- For shadow maps and screen‑space passes, confirm they’re not bigger/longer‑lived than needed.
7) Validate with a measurement plan
Make small, reversible changes; confirm impact with back‑to‑back captures.
Measurement Plan Template Example:
| Experiment | Change | Expected Effect | Evidence in RGP | Result |
|---|---|---|---|---|
| A | Reduce a post‑effect quality step | Shorter fragment work | Lower Fragment work duration in pass | |
| B | Consolidate materials to cut state flips | Fewer context rolls | Reduced context roll counts | |
| C | Shrink an intermediate RT | Less bandwidth and wait | Lower duration/work in affected passes | |
| D | Reorder passes to avoid hazards | Less waiting between producer/consumer | Shorter waits between events |
Some Common Misunderstandings
- Per‑event ≠ per‑frame truth alone. Correlate with gameplay context (use your CapFrameX/PresentMon timestamps).
- Driver barriers happen. RGP can show barriers inserted by drivers, optimize the resource usage pattern, not just shaders.
- Fragment is pricey. It’s common that fragment shading dominates; simplify materials or reduce overdraw before exotic tricks.
- Context rolls are silent killers. Redundant state changes don’t show in game logic, only on the GPU timeline.
- Editor ≠ Player. Always capture from a player build.
- Don’t fabricate numbers. Compare before/after captures; keep results in your repo alongside the build.
For a complementary overview of pipeline concepts, see Unity SRP Overview, Scriptable Render Pipeline.
Stalls and shader issues? I’ll strip, prewarm, and stabilize your pipeline fast so your players are happy to play and pay.
Get the Unity Performance Checklist
Sign up to access the checklist and companion resources in your members area.
Already a member? Open this resource.
Use the checklist’s GPU section to audit targets, barriers, and state changes.
"I help teams cut through GPU myths with captures the whole studio can read", Ruben (TheGameDev.Guru)