
Pushing two simple triangles is almost free for your CPU… But these two triangles can be deadly to your GPU.
How could you know that?
By measuring.
In today’s blog post, I’ll show you how to measure how long it takes your GPU to draw each of your game elements.
No matter if you are an artist, programmer or designer…. Reading this post will help you find out:
- Do you need to optimize at all your game’s GPU usage?
- What parts of your scene should you start optimizing?
- How can you measure the cost of your scene elements?
Let’s dive in one of my favorite tools every developer should have in their tool shelf… Give it up for RenderDoc!

1. Why You Need To Know Your Unity GPU Performance Timings
Unity game optimization is an enormous world.
Your game can have as many bottlenecks as hardware components you have.
So the first step is always to find where your performance bottleneck is.
Only then, you can do something about it.
If you find that you’re pushing your GPU over the edge, that’s good.
That’s your starting point for Unity performance optimization.
But even if you knew your GPU is your bottleneck, the next question becomes: where exactly am I spending so much time?
After all…
- You can push too many vertices.
- You might have too expensive shaders
- You could also suffer from high overdraw
- And more.
In other words, you need to figure out which draw calls are causing trouble to your GPU. And the higher the time cost of a draw call, the bigger the trouble you’re in.
How do we go about finding the GPU timings of our game’s draw calls?
Great, that’s the million dollar question.
I’m about to show you a simple, yet powerful tool to answer all your questions.
2. How to Get Your Game’s GPU Timings with RenderDoc
RenderDoc is a tool every performance specialist should have in their toolbox.
It’s a free, simple and powerful GPU profiler/debugger that will answer questions in a way that Unity can’t.
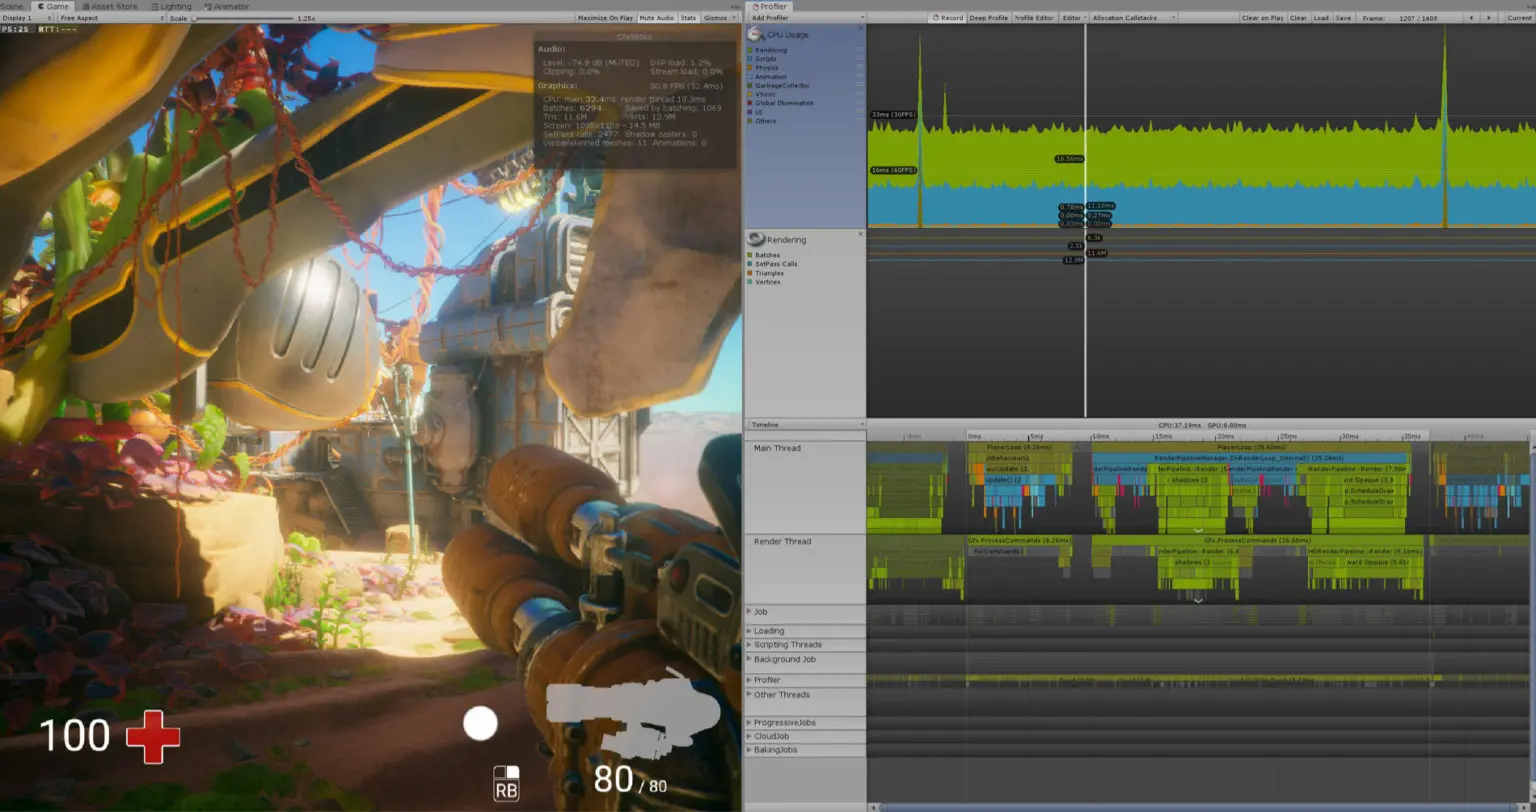
Let’s say you’re running the FPS demo from Unity, which runs on the HDRP (High-Definition Rendering Pipeline). And the project runs as slow as Unity itself when importing a new project.
You want to know which render call in your scene is causing all this mess.
And so, you install RenderDoc.
2.1. Setting Up RenderDoc Integration
The first step after RenderDoc and launching Unity, is to load the pre-installed integration.
You do this by going to Unity’s game tab and simply opening the tab options + clicking on Load RenderDoc.
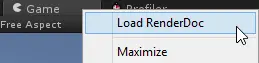
Great. You are ready to go.
2.2. Capturing a Frame in Unity With RenderDoc
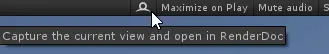
Launch your game in Unity’s play mode and get to the moment (frame) you want to analyze. Pause the game (ctrl + p) and click on the capture frame icon.
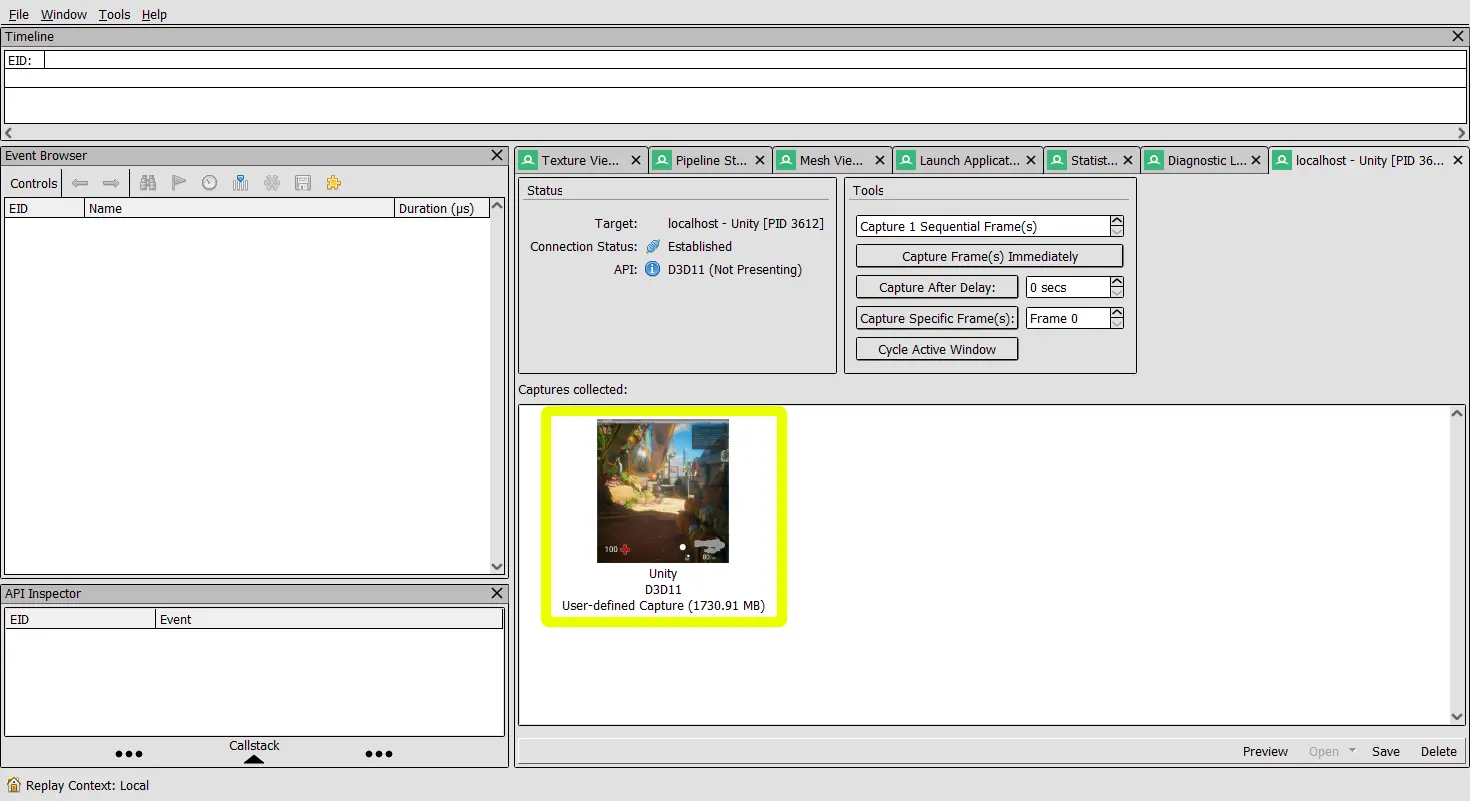
Unity will then open a new instance of RenderDoc with the frame you captured, like below.
You can then double click the frame to load the frame into the RenderDoc frame analysis pipeline.
2.3. Analyzing Frame GPU Costs in RenderDoc
Here is where things get interesting.
On the left you’ll see a list of draw events (mostly draw calls).
These draw calls also include the steps to render the Unity editor itself, so you have to ignore those.
We need to do a bit of digging to find the draw calls of your game. They are usually nested in a group inside the editor rendering cluster.
You’ll typically look for a name like Camera.Render or the such.
You’ll have an easier time if you switch to the Texture View tab. This is the place where you’ll see what each draw call produces in the framebuffer of your game.
You can navigate draw call by draw call and see their effects on the framebuffer (including the GPU cost), as shown below.
<span style=" display:block; font-size: 14px; color: #696969; padding: 5px 0 0 0; max-width: 100%; margin-bottom:30px; "
RenderDoc GPU Timings
What’s better, in this process lies the key to GPU profiling: the per-draw call GPU cost estimation.
How do you get access to the GPU timings?
Easy.
Click the “calculate timings” button that looks like a clock and RenderDoc will show you an estimated cost of your draw calls.
Now, many people learned not to trust the metrics. And that’s right… with one caveat.
While you cannot rely on the absolute numbers, you can trust the relative metrics.
In other words, don’t believe “rendering this 3d female character takes 1.5 milliseconds“, but do believe that “rendering this 3d female character is twice as expensive as rendering the male version“.
Now you know what parts of your scene you should spend your efforts on.
And that, my friend, is the key to GPU Profiling.
Get the Unity Performance Checklist
Sign up to access the checklist and companion resources in your members area.
Already a member? Open this resource.
What’s Next?
Unity GPU Performance Profiling is just one part of the big picture.
You’ll have different bottlenecks at different moments of your game. And these will change.
So keep something that reminds you of the entire game performance journey.
Grab my free Unity Game Performance Checklist and start optimizing your game right away.
~Ruben