Access your Unity Memory Metrics without attaching the Profiler? I’m sold! Let me introduce you to the new Unity Memory Profiler Module available since Unity 2020.2b.

Imagine This
Would you like to…
- Run automated performance tests.
- Issue a warning when your memory usage exceeds a certain amount, e.g. 500 MB.
- Display your memory usage trend over the development cycle — divided by asset type
… but you never tried because you knew you couldn’t because you depend on attaching the profiler?
Well, that no more.
Since Unity 2020.2 you have access to a new API that will give you all sort of metrics without even attaching the profiler.
And even better, many of these metrics work on release builds.
Juicy.
The Solution: The Unity ProfilerRecorder API
Here’s how it works.
- In a script of your choice, import the Unity.Profiling namespace.
- This namespace will give you access to the ProfilerRecorder class.
- ProfilerRecorder will record the specific metric of your choice, e.g. texture memory used.
- You start a recording session, you poll for its values and you dispose it when you’re done.
A typical pattern is to use this in a memory-intensive section of your game that you want to track, such as a boss fight where many enemies are present.
Here’s an example:
public class MemoryProfiler : MonoBehaviour
{
    string _statsText;
    ProfilerRecorder _totalReservedMemoryRecorder;
    ProfilerRecorder _gcReservedMemoryRecorder;
    ProfilerRecorder _textureMemoryRecorder;
    ProfilerRecorder _meshMemoryRecorder;
    void OnEnable()
    {
        _totalReservedMemoryRecorder = ProfilerRecorder.StartNew(ProfilerCategory.Memory, "Total Reserved Memory");
        _gcReservedMemoryRecorder = ProfilerRecorder.StartNew(ProfilerCategory.Memory, "GC Reserved Memory");
        _textureMemoryRecorder = ProfilerRecorder.StartNew(ProfilerCategory.Memory, "Texture Memory");
        _meshMemoryRecorder = ProfilerRecorder.StartNew(ProfilerCategory.Memory, "Mesh Memory");
    }
    void OnDisable()
    {
        _totalReservedMemoryRecorder.Dispose();
        _gcReservedMemoryRecorder.Dispose();
        _textureMemoryRecorder.Dispose();
        _meshMemoryRecorder.Dispose();
    }
    void Update()
    {
        var sb = new StringBuilder(500);
        if (_totalReservedMemoryRecorder.Valid)
            sb.AppendLine($"Total Reserved Memory: {_totalReservedMemoryRecorder.LastValue}");
        if (_gcReservedMemoryRecorder.Valid)
            sb.AppendLine($"GC Reserved Memory: {_gcReservedMemoryRecorder.LastValue}");
        if (_textureMemoryRecorder.Valid)
            sb.AppendLine($"Texture Used Memory: {_textureMemoryRecorder.LastValue}");
        if (_meshMemoryRecorder.Valid)
            sb.AppendLine($"Mesh Used Memory: {_meshMemoryRecorder.LastValue}");
        _statsText = sb.ToString();
    }
    void OnGUI()
    {
        GUI.TextArea(new Rect(10, 30, 250, 70), _statsText);
    }
}
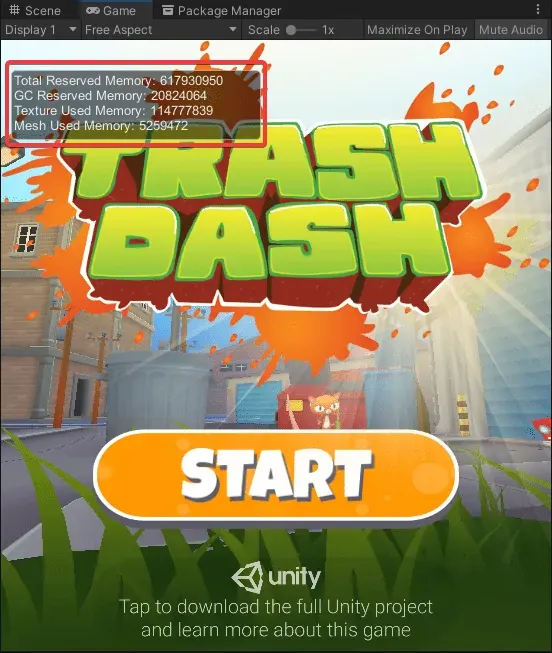
And here’s how it looks:

Unity Memory Profiler Module: The Metrics
Right now, you have access to the following metrics:
- Total Used Memory
- Total Reserved Memory
- GC Used Memory
- GC Reserved Memory
- Gfx Used Memory
- Gfx Reserved Memory
- Audio Used Memory
- Audio Reserved Memory
- Video Used Memory
- Video Reserved Memory
- Profiler Used Memory
- Profiler Reserved Memory
- System Used Memory
- Texture Count
- Texture Memory
- Mesh Count
- Mesh Memory
- Material Count
- Material Memory
- AnimationClip Count
- AnimationClip Memory
- Asset Count
- GameObjects in Scenes
- Total Objects in Scenes
- Total Unity Object Count
- GC Allocation In Frame Count
- GC Allocated In Frame
Green means that the metric is available on Release builds, while red metrics are only on development builds.
You can see the full documentation here.
Some Ideas to Try Out
I already gave you a few, but here are a few more:
- Make a special build to track the memory usage over the entire game-play during your play tests. Find the maximum and see if that’s acceptable compared to your minimum requirements.
- Check that the memory usage in the start menu remains the same after entering a level and coming back to the start menu. This helps locating potential memory leaks.
- Record which levels take more memory and prioritize these for further optimization.
- Look for large increases on memory consumption across different builds. You might have added an asset with wrong import settings.
What’s Next?
You need some sort of memory tracking to make sure your game doesn’t crash in low-end devices.
But one thing is to notice them, and another is to fix them.
The natural second step is actually reducing the memory usage of your game. For that, you can read my Introduction to Unity Addressables.

Let me know if you plan to use the ProfilerRecorder API and what your use case is.
I certainly have big plans for it 🙂
~ Ruben (The Gamedev Guru)

