
Every game should get a profiling session. Optimally, you should make it happen regularly by using the archifamous Unity profiler tool. But this tool will often give you misleading results for a reason I’m about to explain. Let’s see how to be more accurate using the new Unity Profile Analyzer.
When you profile your game, a few things can happen.
You can find that everything is alright and there’s no further action needed. This is rarely the case with any ambitious game.
Often enough, you’ll find out that the new feature you implemented is just too expensive for a portion of the hardware you’re targeting.
However, there’s something I discovered over the years while working with Unity…
Here’s my learning: the Unity Profiler is not accurate… by far.
Let me explain why and what you can do about it.
In this blog post, you’ll learn:
- Why the Unity Profiler is revealing you only one side of the whole story
- Why you should immediately stop relying exclusively in the unity profiler
- How to welcome the unity profile analyzer to your toolbox to become more numbers-driven in your analysis
Why the Unity Profiler Is Not Enough
I started with a blunt affirmation: using the unity profiler alone will not give you the accurate results you’re seeking.
But wait, don’t start writing hateful comments just yet. Let me elaborate on what many would consider blasphemy.
The unity profiler is itself accurate, but almost every game developer is making a dangerous assumption that will make these numbers very misleading.
Instead of getting lost in words — I’m pretty skilled at it — let me show you an example:
void Update()
{
  image.rectTransform = image.rectTransform + Vector3.one * Time.deltaTime;
  character.transform.position = character.transform.position + Vector3.forward * Time.deltaTime;
}
You see what I’m doing there?
It’s very basic. It’s just a few instructions that I apply on a thousand game objects. This function shouldn’t cause performance issues, but let’s profile it anyway.
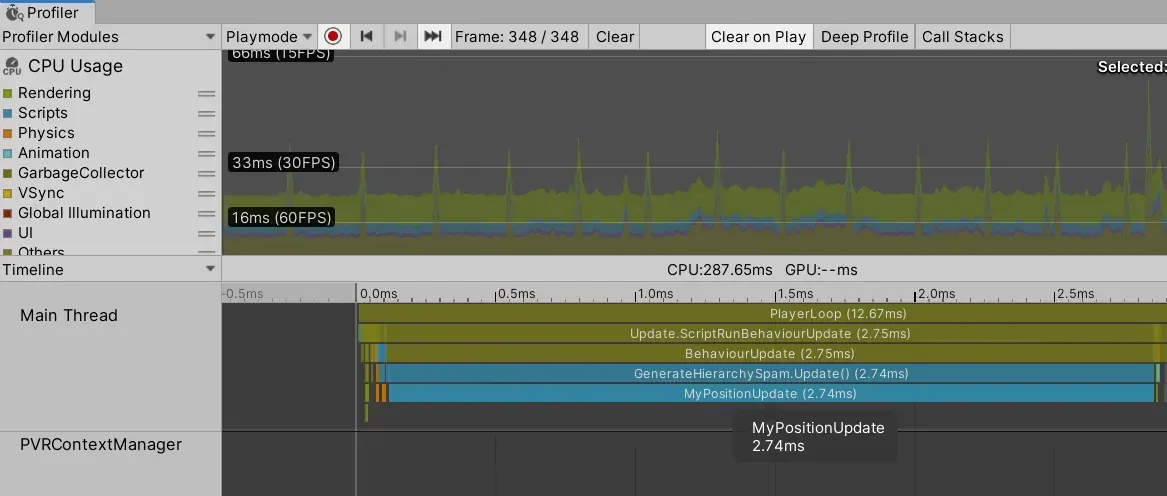
This is the cost of running this function: 2.74 milliseconds. Acceptable.
However, if we stop our profiling session there, we’ll make the mistake 95% of the developers do.
You see, the profiler will surely give you the accurate cost of executing your function.
But here’s the key: we’re missing to measure the cost of the side-effects this function causes.
Profiling your function will not show you its total cost on the game performance, but only its internal execution cost.
Let’s zoom out of the function. Here’s what the profiler looks like now.
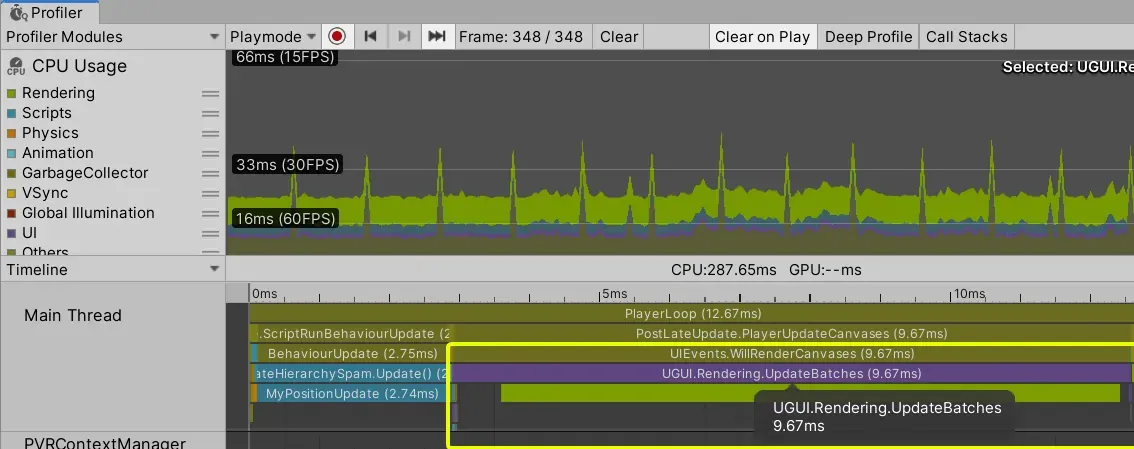
The panorama the profiler paints now is somehow… different.
The thing is, it’s easy to see the side effects of such code in an empty project like above. In this case,
changing the rectTransform incurs in a canvas rebuild that takes place just before rendering.
But we rarely work with empty projects, which makes these side effects go unnoticed 95%+ of the times as I have seen with almost every game developer I coach.
Now that you’re aware of the hidden cost of the code that you were probably not measuring, the question turns to: how can you and I become more accurate at diagnosing the real game performance impact of a change?
Unity Profile Analyzer: How to Become Numbers Driven
As we saw, using the Unity Profiler is clearly not enough to get the total performance cost of a function, much less of a feature or a change.
If your function interacts with the Unity API, chances are high that it might have side effects later on the profiling road.
Luckily for us, fellow developers, we have a fairly new tool at our disposal: the Unity Profile Analyzer.
Let me tell you what this tool will do for you.
The Unity profile analyzer is a package that excels at giving you statistical information about the performance of your game.
And how does that help us?
With the Unity profiler, we capture about 300 frames and then analyze per-frame costs.
Instead of doing this, we can use Unity profile analyzer to statistically analyze the performance metrics of the entire profile session.
This per se is great, but it doesn’t solve the problem.
So here’s the key: on top of that, Unity engineered the possibility of comparing different profiling sessions.
Aha, now we’re talking.
Do you see where I’m heading to already?
Let’s have a look at a more accurate performance analysis strategy.
The New Performance Analysis Strategy
The strategy to get accurate measurements shifts from profiling your function to:
- Get a deterministic scenario for consistent performance results
- Profile baseline version (A)
- Profile version with the new change or feature (B)
- Compare versions A and B and reach a conclusion based on solid statistical data
This is what I call A/B game performance test.
Does it sound like more work?
Yes, it is indeed more work.
But it’ll be rewarding. That I promise to you.
If you’re a professional game developer, you need to know about this performance analysis technique.
Why?
Because judging performance is all about using meaningful numbers. And these numbers have to include all costs, not just a possibly small portion of the whole picture.
Let’s have a look at the Unity profile analyzer tool.
The Unity Profile Analyze Package
Let’s have a brief look at the Unity profile analyzer.
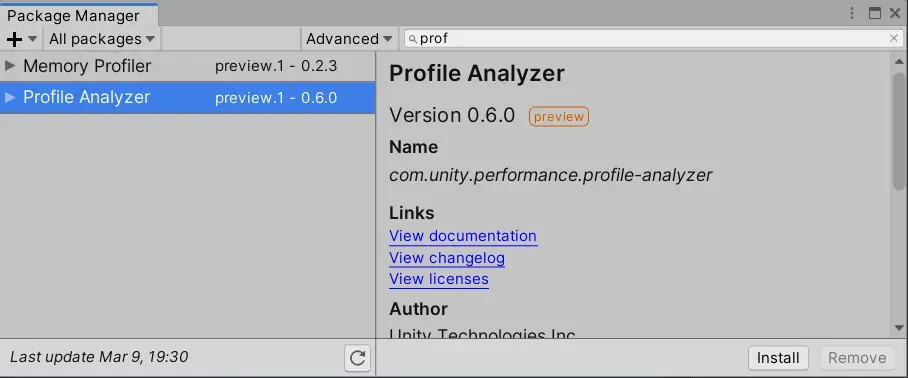
Start by installing it through the package manager. As of today, it’s still a preview package so you’ll have to tick the display option in the advanced menu.
You can then open the Unity Profile Analyzer through Window → Analysis → Profile Analyzer.
The unity profile analyzer’s main interface is divided in four main sections as I show you below (click to zoom in).
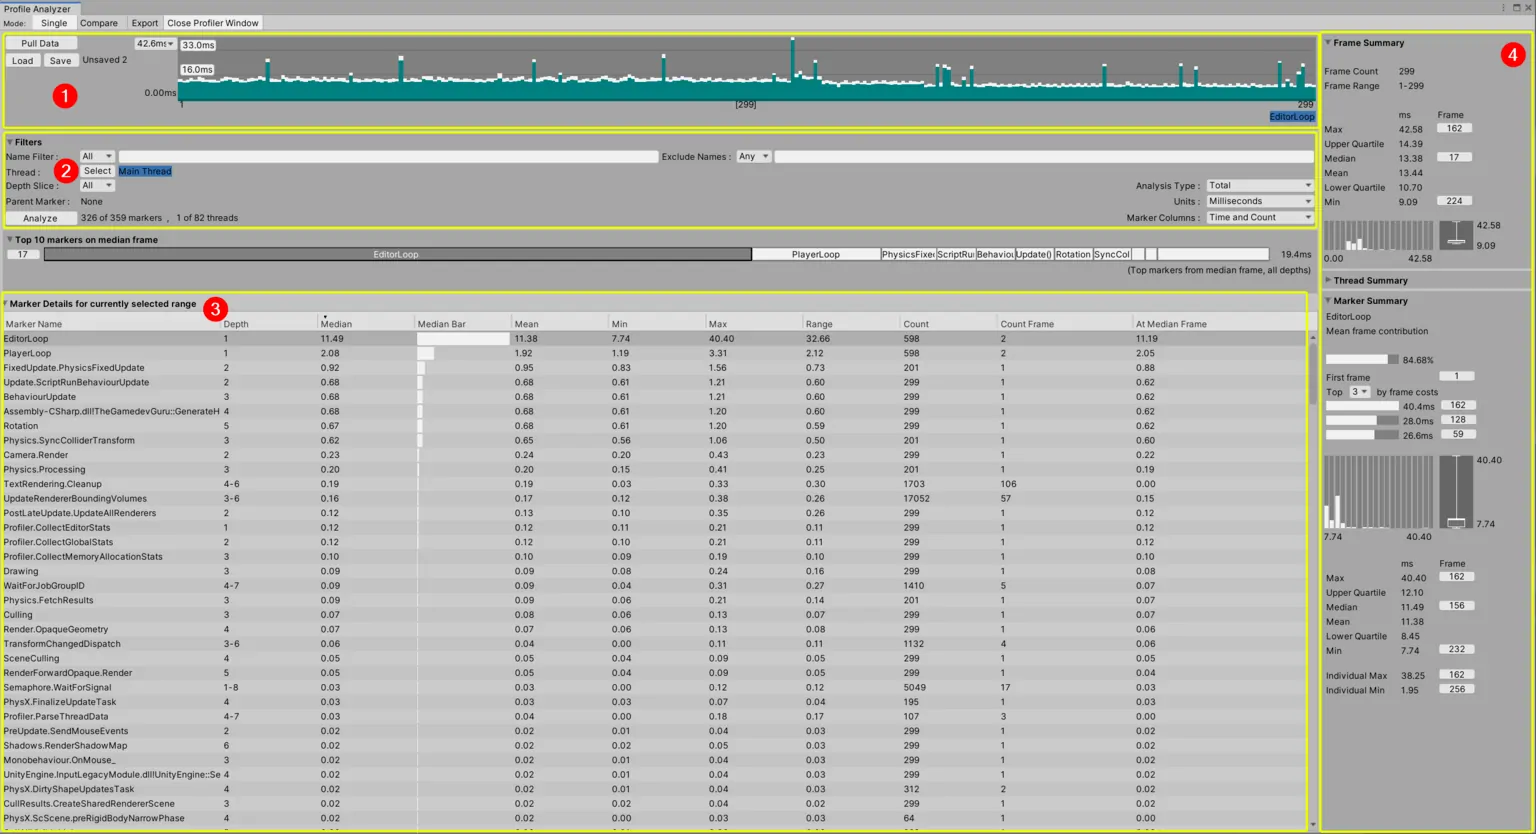
Based on the numbers I wrote in the picture:
- (1) The file input/output operations
- (2) Filters panel
- (3) The markers table
- (4) The statistical summaries
The top section contains the file input/output operations (1). You’ll use this section to load the profiles you captured through the traditional unity profiler. Here you can analyze single captures and compare two captures.
Below the file I/O section you’ll find the filters panel (2). Here you can filter markers by name, e.g. by function name, for physics, occlusion culling, etc… It’s often useful to exclude markers such as EditorLoop and vsync operations.
On the bottom part of the window you’ll see the most important area: the markers table (3). You’ll spend most of your analysis time here.
This table shows you the statistical cost of each marker you’d typically see in the unity profiler. This tool aggregates these numbers for the entire profile session, just for you.
You’ll get access to the mean, average, minimum, maximum and my favorite performance metric: the quartiles. Quartile performance analysis is extremely helpful to ensure a smooth gameplay, compared to using averages.
Finally, on the right side, you’ll have access to summarized statistics (4). The Frame Summary shows you relevant statistical data for the frames you select (all by default).
If you’re interested in a specific marker (e.g. a new function), then you’ll find the marker summary very valuable. This reveals statistical information about your selected marker.
This tool becomes especially relevant when you do A/B game performance testing, as I described in the strategy section. You do this by switching to profile comparison mode:
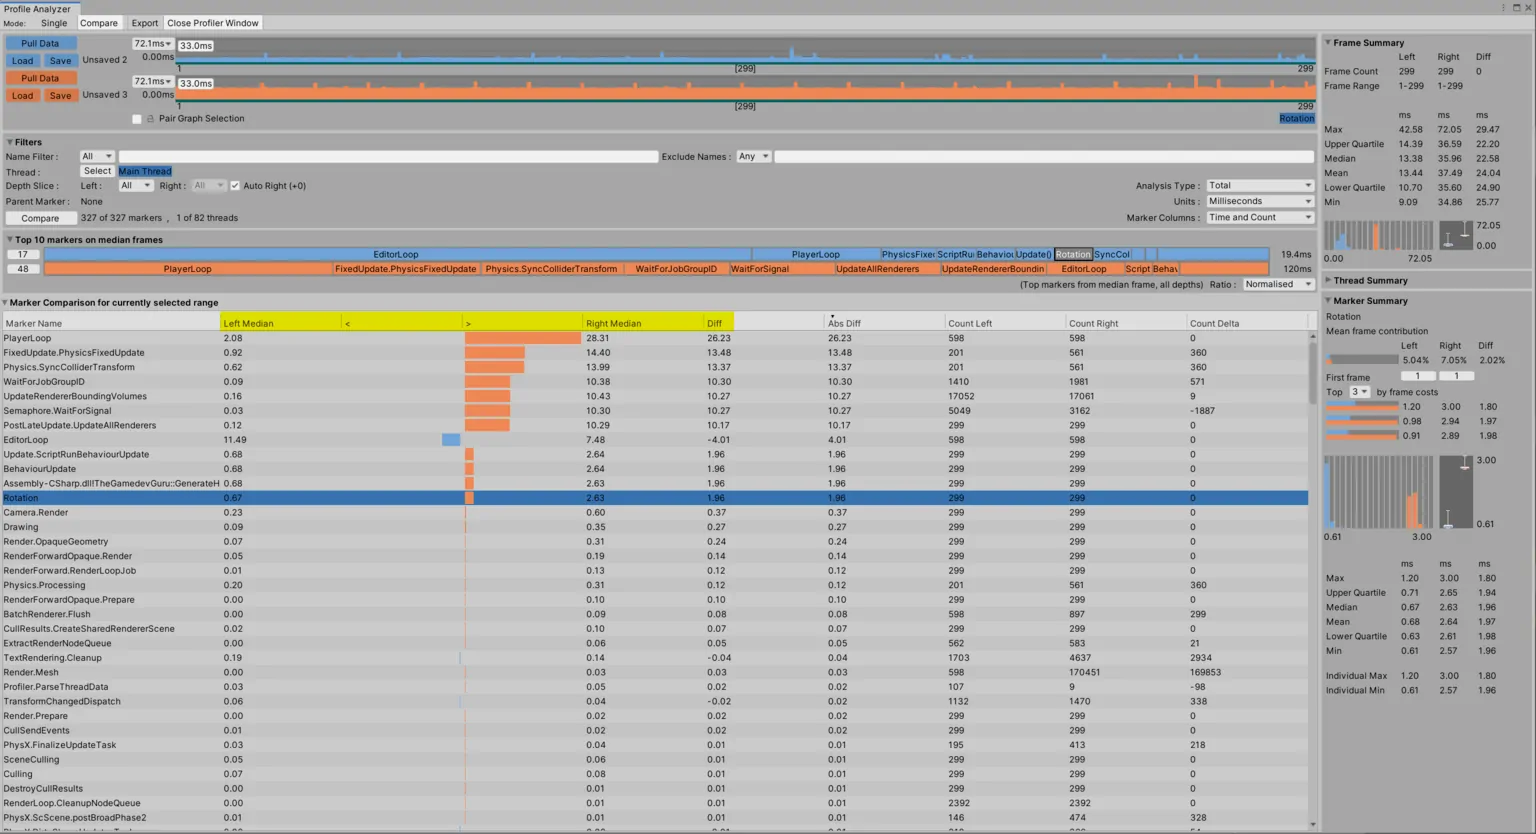
Here you see a statistical comparison between the baseline and the changed builds. The comparison is done on a per-marker basis and also by comparing the statistical summaries on the right panel.
Comparing profiles through A/B performance testing is ideal because you test the game as a whole. You capture all performance costs — including side effects — of a specific change you did: new features, a performance optimization, etc..
But I get it — this article might sound a bit abstract if you’re not experienced in game performance analysis.
The best way to get the hang of it is to go through an example and then to do it yourself.
And I’m about to help you there.
Example: The Unity Profile Analyzer Workflow
In this post I started by outlining the problem that most unity game developers suffer from: too broad assumptions while measuring game performance.
I then made the case for an upgraded performance analysis workflow using the Unity Profile Analyze tool.
However, it might be hard to see the practical benefits until you experience them yourself.
So I prepared a short case study where I walk you through the A/B performance analysis I did on an example project.
In this case study, I’ll show you step by step how I analyze the performance impact of invoking commonly used and innocent-looking Unity API functions.
By reading it, you’ll instantly gain a new perspective that you can start applying today in your game.
Get access to my case study below to continue your journey towards becoming a Unity performance expert.
Find out how I use the brand new Profile Analyzer to do proper performance measurements.
Start being more accurate today.
"
/>