
Complex scenes, huge C# assemblies, expensive initialization in your scripts… All of them lead to slow iteration times in the Unity editor.
But why exactly is your editor so slow in your specific project at entering and exiting play mode?
And more importantly, how can you cut your iteration times every time you touch any of your C# scripts?
You don’t need to take more blind guesses.
Instead, ask Unity Iteration Editor Profiler.
How to Waste Time — Iteration Times
You are coding a gameplay feature in C#.
You save, switch to the editor and wait 20 seconds due to compiling.
Now you enter play mode and wait another 20 seconds.
Oops, you realized you applied the physics force in the wrong axis.
Exit play mode and wait another 20 seconds.
You make your change in C# and start the iteration all over again.
You just wasted 60 seconds in this iteration.
That’s probably enough for a short coffee break. But it isn’t great if you aim to get your game on the store ASAP.
Ok, everybody deals with slow iteration times when projects evolve.
But barely anyone knows how to fight back this gamedev productivity killer.
So today I’m showing you a new toy that empowers you to spot who exactly is wasting your time during:
- C# compilation iteration times.
- Entering play mode.
- Exiting play mode.
And this toy has a name: the Unity Editor Iteration Profiler.
Can You Help Me, Unity Editor Iteration Profiler (EIP)?
The Editor Iteration Profiler is a new tool that lets you identify and measure where your waiting times are going in your assembly reloads and play-mode operations.
This window will persist the performance metrics for the entire editor session, i.e. you won’t lose them just like when you hit the sample count in the original profiler.
Before we move on, let’s have a quick expectation-adjustment GIF:
Unity Editor Iteration Profiler EIP Sample
That’s the type of output you can expect from this tool.
Still with me?
Let’s see how to install it.
Installing the Unity Editor Iteration Profiler (EIP)
Just download the latest ZIP from the Unity EIP GitHub repository (shortcut here).
Then, extract its contents into your Packages folder.
That’s it.
Expected something harder? The instructions would even fit in a tweet.
Spotting Productivity-Killers With Unity Editor Iteration Profiler
Let’s get the Unity EIP to work in one of the projects I have lying around.
Just open the main Unity Editor Iteration Profiler panel by navigating to Windows → Analysis → Editor Iteration Profiler → Show Window.
Then enable recording, enter play mode and have a coffee break.
Perfect. The right time for a coffee break.
Here are the results.
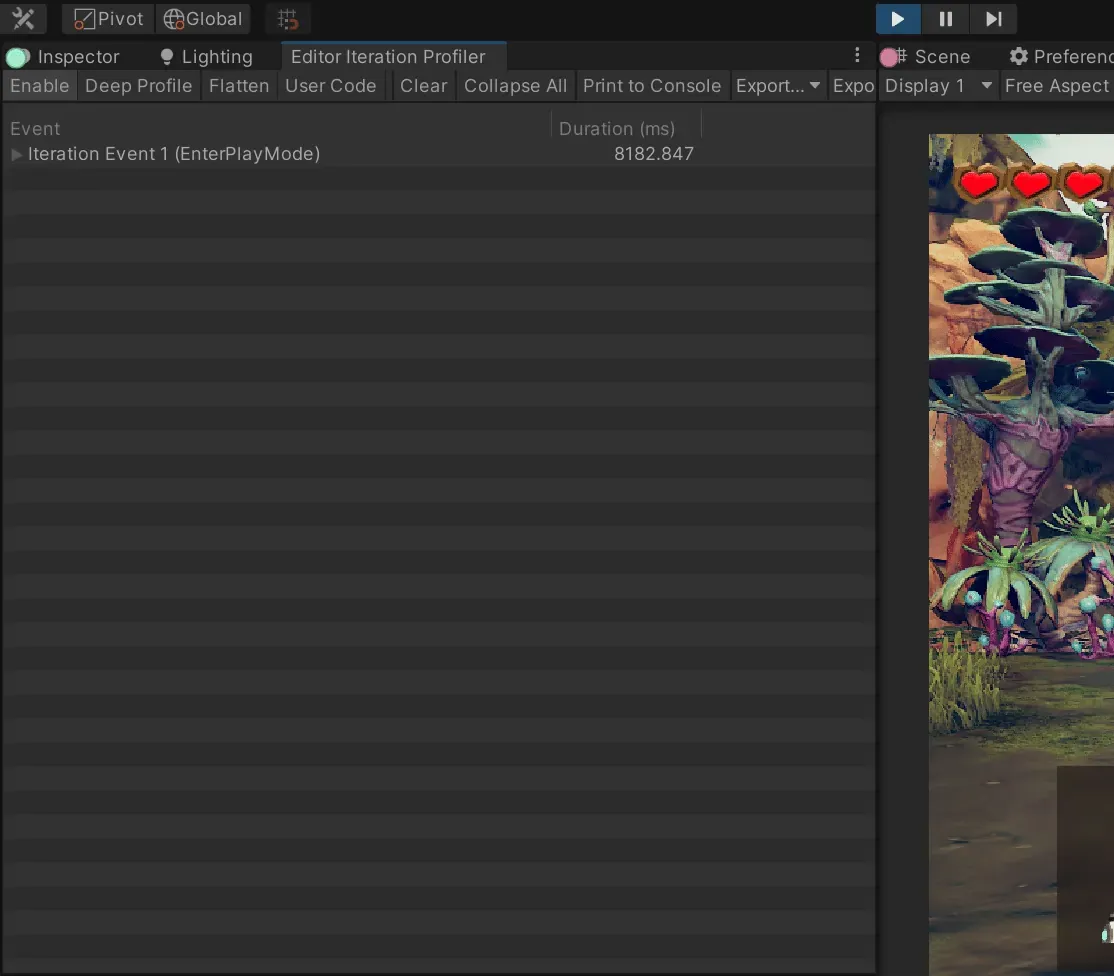
8 seconds.
Not very useful, let’s uncollapse that marker.
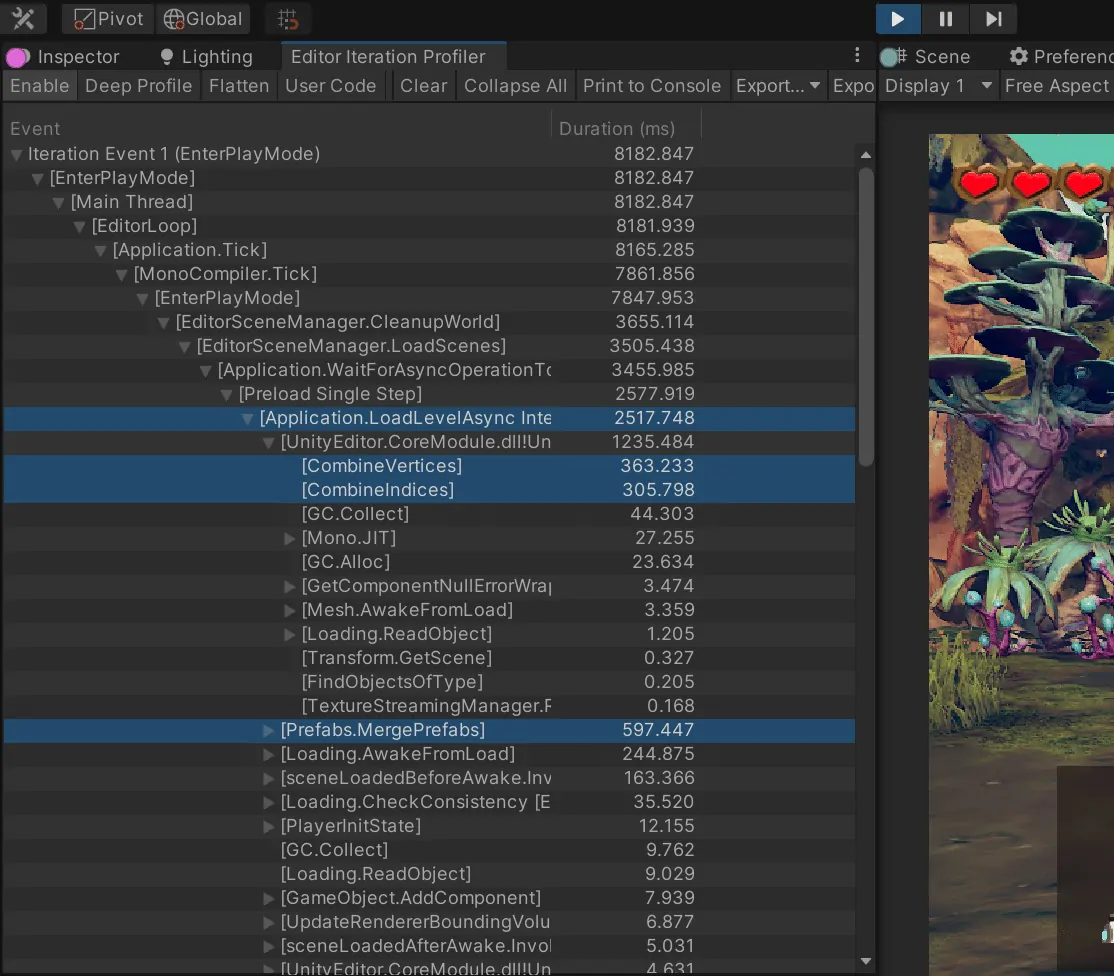
Ok, now we’re getting somewhere.
When loading the level, we are paying considerable time for combining vertices, indices and merging prefabs.
To me that sounds like preparing static batching.
So that’s one of the iteration time costs we are paying for every time we hit play. Preparing the batches that come from static renderers.
But wait, there’s more.
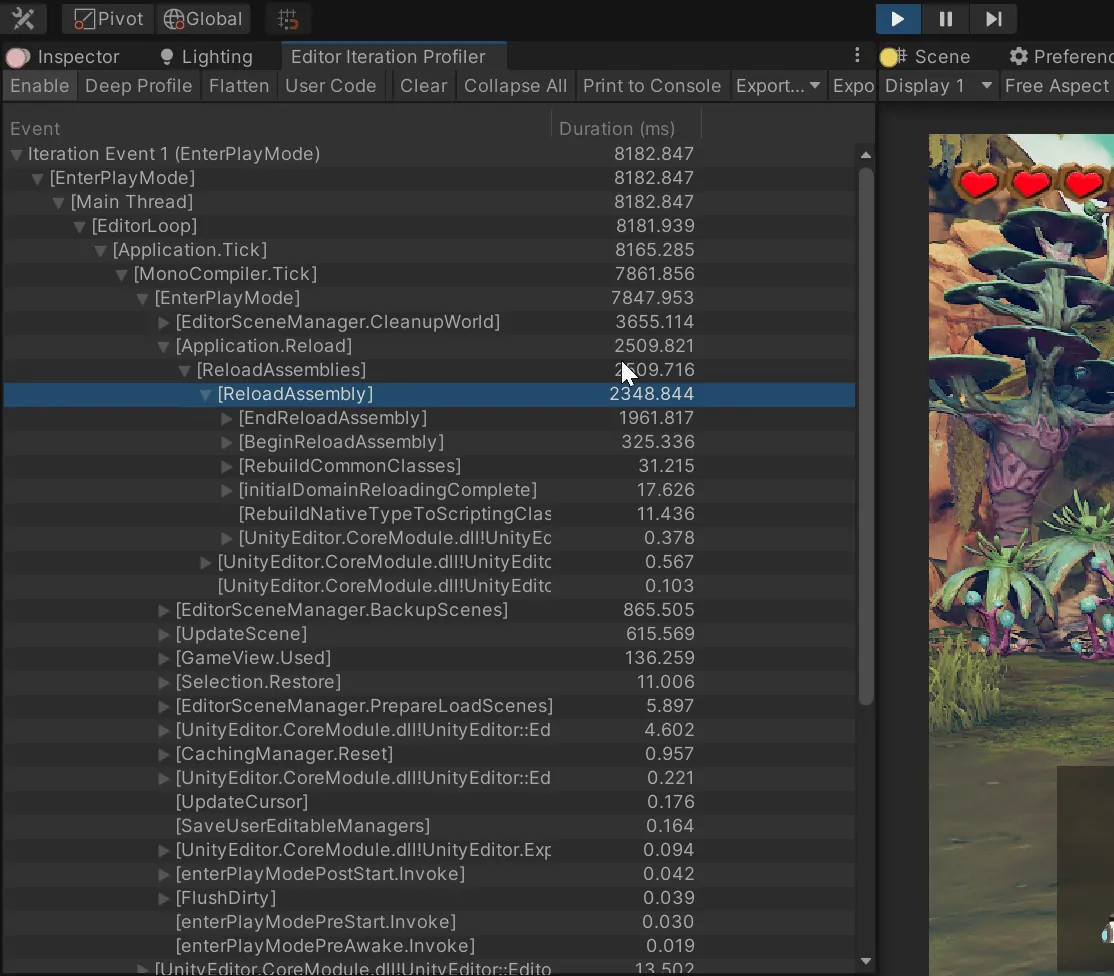
Reloading assemblies taking above 2 seconds. And backing up scenes took almost a second.
What a surprise (or not).
Actually, that was to be expected. Especially if you read about Domain Reloading and the optimizations you have available to fight these slow downs.
It’s great to have this information.
Sure, it doesn’t mean you can always do something about it. But most of the times you’ll manage to squeeze a few seconds out of these iteration times.
And a few seconds aggregate to minutes each day. And to hours each month.
These wasted minutes might well be the difference between calmly going to sleep after closing a ticket… or having nightmares because of the cognitive load an open ticket put on you.
Get the Unity Performance Checklist
Sign up to access the checklist and companion resources in your members area.
Already a member? Open this resource.
What’s Next?
These are just the basics: finding where you are wasting your time. There’s much more to this tool, so visit the official documentation to explore all the options.
That’s only the first step, of course.
The second part is all about you fighting the time-robbers this tool uncovered for you.
If you want to learn more performance optimization tricks, check out my Unity Performance 100+ Checklist.
~Ruben