Myth: “The Unity Profiler shows everything.” Reality: It shows what’s instrumented. Sampling profilers reveal the rest.
You’ve got a Windows standalone build on a typical desktop machine. Players feel hitches, but your Editor profiler looks calm. You need whole‑process visibility, engine and scripts, without touching code.
You prep a build with symbols, attach Very Sleepy, and the call stacks start drawing you a map from PlayerLoop → render path → your MonoBehaviour.Update(). Now you know where to dig.
TL;DR
- Pick the right lens: Instrumentation shows what you marked; sampling profiles any process and surfaces native/engine hot paths you can’t see otherwise.
- Build for readable stacks: Use IL2CPP, enable Stack Trace Information, set Managed Stripping Level to Minimal, and keep PDBs handy for symbol resolution.
- Read what matters: Sort by exclusive vs inclusive time, then climb the Called From/Calls stacks to find actionable parents and children.
- Find your code fast: Filter to PlayerLoop and watch module names (
GameAssemblyfor your scripts;UnityPlayer/graphics runtime for engine) to separate concerns. - Don’t ship secrets: Keep PDBs/symbol folders out of your release package; store them in your build archive.
Why this matters (to you and your players)
Sampling profilers give you a view that doesn’t depend on where markers exist. That’s how you spot the engine work your scripts provoke and the native calls your markers didn’t cover.
Business line: Seeing true hot paths earlier shortens debug cycles and protects retention at launch.
The opportunity cost
If you only watch instrumentation, you optimize what you can already see and miss the work that actually costs. That’s how teams spend sprints on the wrong culprits, ship regressions, and invite churn.
Mechanics: sampling vs instrumentation (and a road‑trip analogy)
There are two profiling families here:
- Instrumentation‑based: Unity (and you) place begin/end samples around code paths. Great precision where markers exist; invisible elsewhere.
- Sampling‑based: A profiler pauses the process at intervals and records where each thread is. Think of a kid asking “are we there yet?” at regular intervals, annoying for the driver, but you learn where the car is. You don’t add code; you see the whole program.
Grounded takeaways: • “One is instrumentation‑based profiling and the other option is sampling based profiling.” • “Sampling profiling is easy to apply because you can do this with any process.” • “you need debugging symbols, the PDB files. Otherwise it's going to only show you gibberish.”
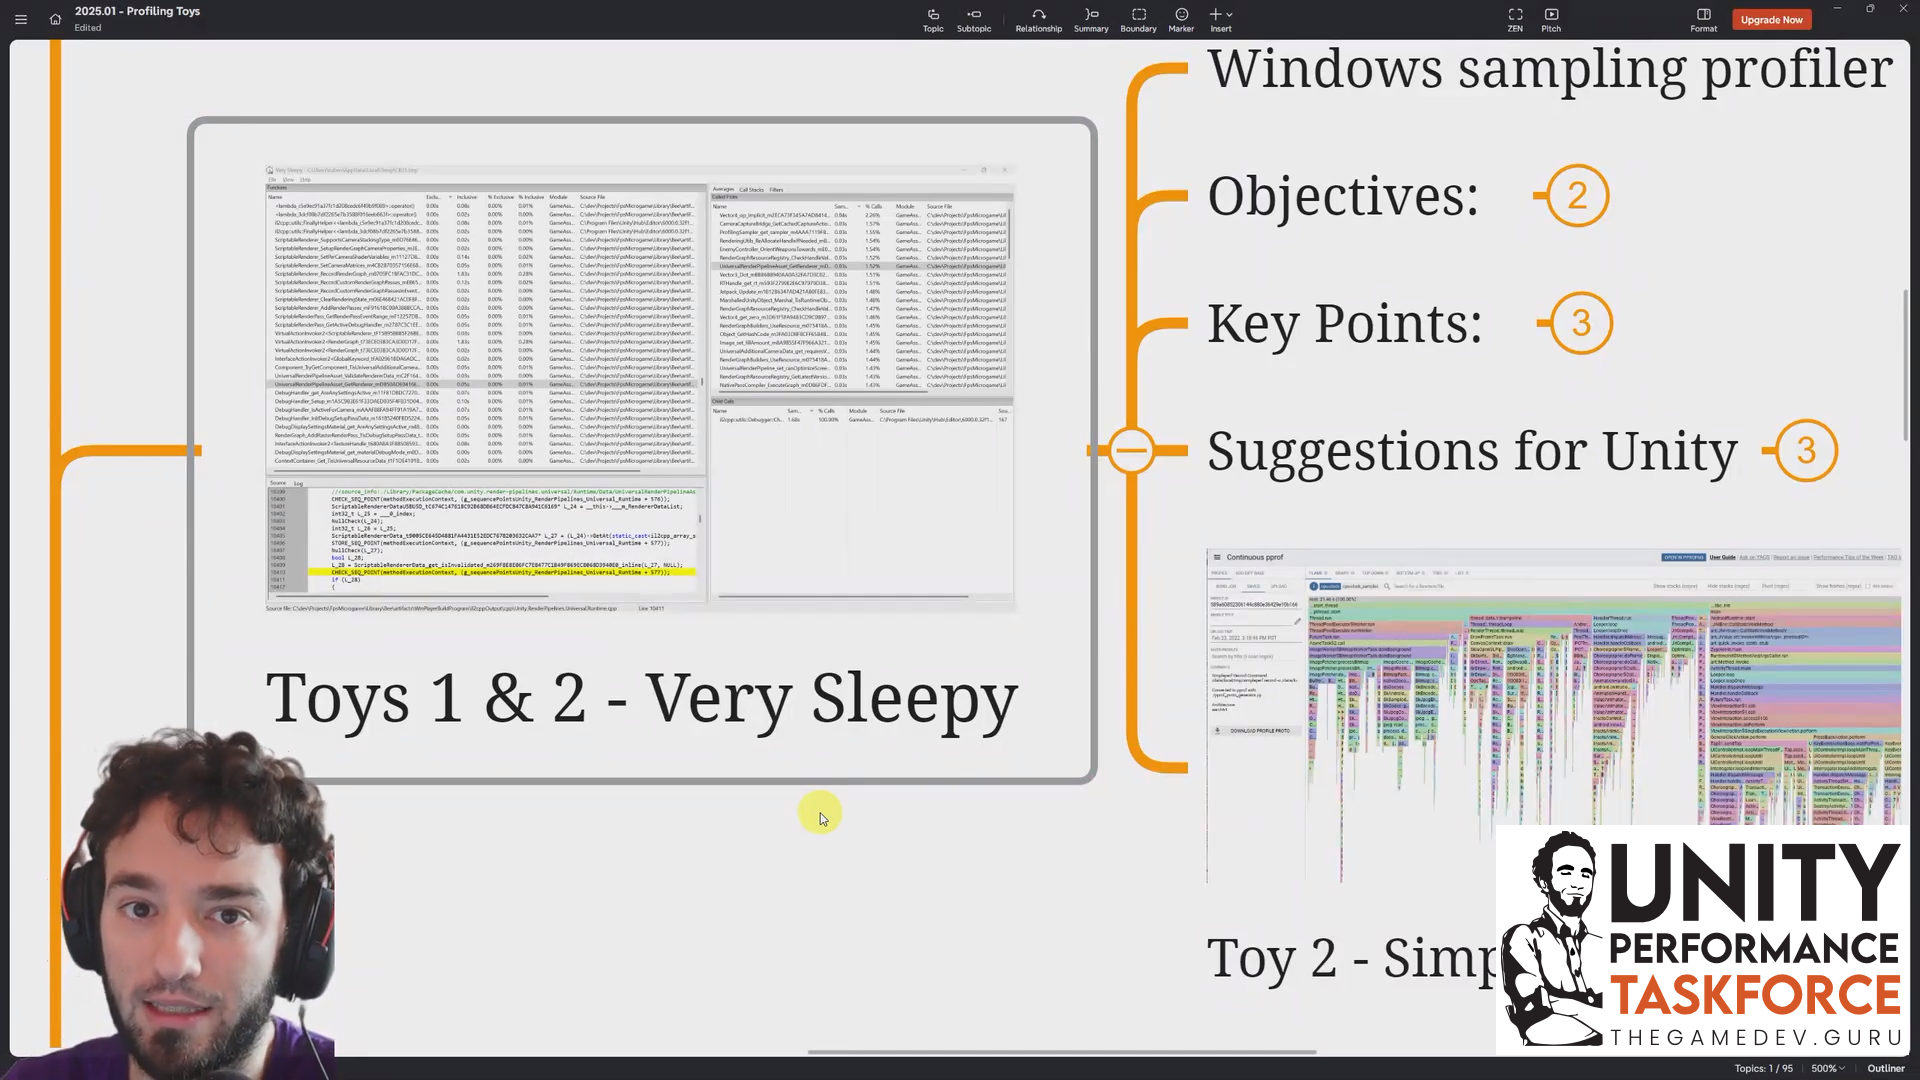
The Blueprint: Very Sleepy field‑ops
Follow this once and you’ll reuse it across projects.
1) Build setup for readable stacks
- Switch to IL2CPP
Edit → Project Settings → Player → Other Settings → Scripting Backend (IL2CPP) - Max stack trace info (names & lines)
Edit → Project Settings → Player → Other Settings → Stack Trace Information - Minimal stripping (keep symbols useful)
Edit → Project Settings → Player → Other Settings → Managed Stripping Level → Minimal - (Optional) Development Build + Script Debugging
File → Build Settings → Development Buildand enable Script Debugging for more verbose codegen. - (Optional) Auto Graphics API
Edit → Project Settings → Player → Other Settings → Auto Graphics API(adjust as your other tools require). - Archive PDBs from the build output (do not ship them).
Grounded: “IL2CPP, stack trace information, mark everything, method name, file name, line number” and “Stripping level set it to minimal”.
2) Point Very Sleepy at your symbols
- Tools → Options → Symbol Search Path → add the build’s symbol folders (e.g.,
GameAssembly*.pdb, Managed). - Optionally run Tools → Download Symbols after selecting your process.
3) Capture
- Launch your game build.
- In Very Sleepy, select your game process, then Profile All for a short representative segment of play. Stop capture when done.
4) Read the lists like a pro
- Sort by Exclusive Time to see functions slow by themselves.
- Toggle to Inclusive Time to see “cost including children.”
- Use the right‑hand Called From / Calls panes to climb and descend the call tree.
Exclusive vs Inclusive refresher: Exclusive = time in the function’s own body. Inclusive = that plus all child calls.
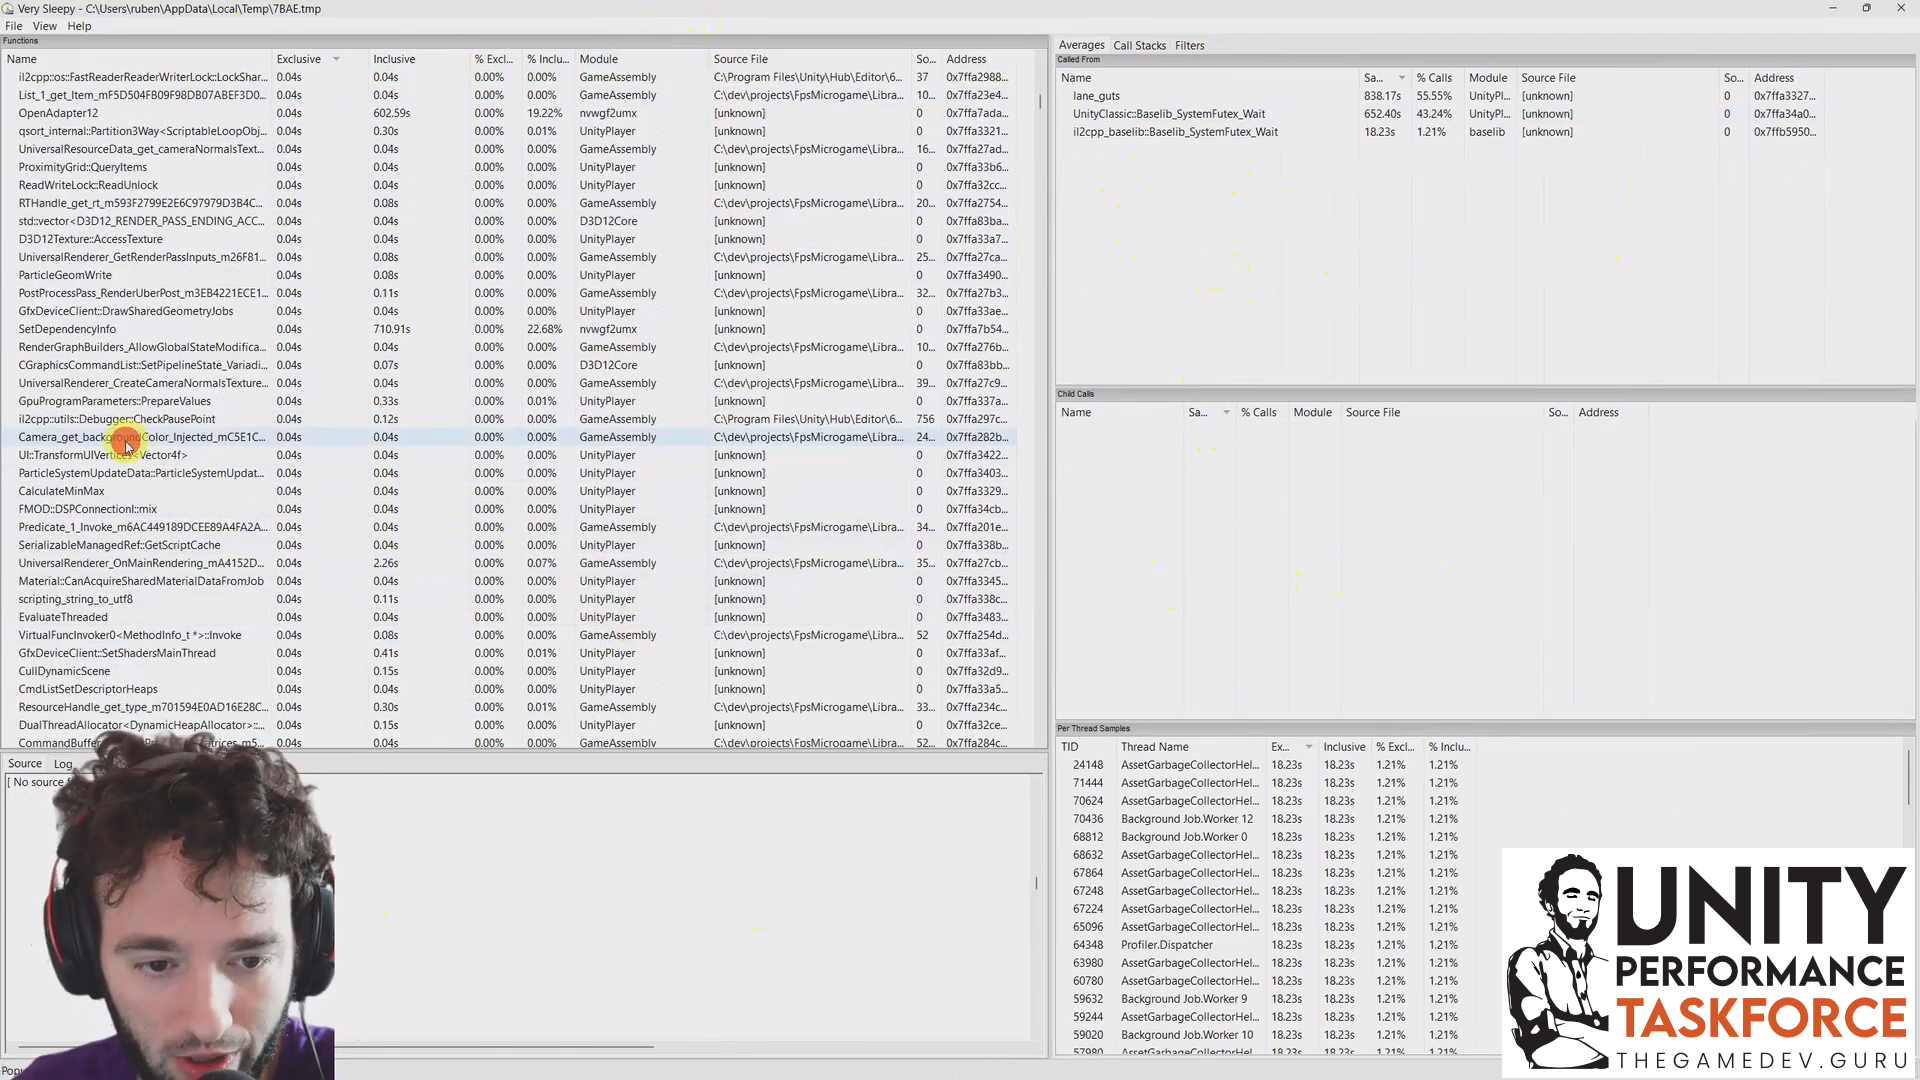
5) Find your code and Unity’s code quickly
- Type “PlayerLoop” in the function table to jump to gameplay execution.
- Look at the Module column:
GameAssembly→ your scripts and IL2CPP‑generated code.UnityPlayer/ graphics runtime → engine work.- From
PlayerLoop, step intoBehaviourupdates and locate your classes by name.
6) Decide next step
- If a hotspot is engine work invoked by your code (e.g., transforms, rendering, physics queries), refactor the call pattern in scripts.
- If it’s your method’s exclusive time, optimize the algorithm or allocations.
- If it’s deep in graphics, cross‑check with Profiling Standalone Mode and bring in a GPU tool next.
A tiny instrumentation snippet (for contrast)
Even with sampling, you’ll still add markers where you own the code.
using UnityEngine;
public class ExampleHotspot : MonoBehaviour
{
    void Update()
    {
        UnityEngine.Profiling.Profiler.BeginSample("ExampleHotspot.Update");
        // ...your logic...
        UnityEngine.Profiling.Profiler.EndSample();
    }
}
Use this to enrich the Editor profiler; rely on sampling to see beyond it.
Gotchas (read before you chase ghosts)
- No symbols ⇒ gibberish. Fix the PDB path first.
- Don’t ship PDBs. Keep them in your internal build archive only.
- Sampling can miss very short functions. If it’s truly tiny, it may not matter; verify with multiple captures.
- Thread names help context. Expect entries like job workers, graphics device worker, audio, etc.
- UI overwhelm is normal. Start from
PlayerLoop, then branch out. - Tooling side‑quests. Simpleperf on Android follows the same method, different tooling.
In the next post, we dig into Superluminal for Unity , Fast Hot‑Path Hunting with Filters & Histograms , read it here.
If your studio could use some help, we offer Unity consulting services here
Get the Unity Performance Checklist
Sign up to access the checklist and companion resources in your members area.
Already a member? Open this resource.
Grab the Performance Checklist, turn captures into a prioritized fix list.
/unity-performance-checklist/
We help teams move from “we think it’s fine” to “we know it’s fixed.”
Ruben (TheGameDev.Guru)