
You spend an infinite amount of time optimizing your Unity UI. But, all it takes to really screw up performance is a sneaky modification on a tiny attribute of an almost invisible Canvas UI element. And when that happens, not even Unity UI Profiling will save you from dropping frames. Are you ready for the road ahead?

This is what happened in my last project…
I worked hard to optimize the several UI panels of our port to Oculus Quest. This was mostly about reducing the overdraw level to an acceptable amount to make sure the GPU would be all comfy with the real 3D rendering.
So I worked on Unity UI Optimization for at least a month and made pretty damn good progress.
At some point, it was so well optimized that the GPU timings were barely moved by the UI. The opaque UI shading techniques I applied compensated most of the overdraw caused by UI Layering (elements drawn on top of other elements).
There I was, with a super optimized hybrid UI system that effectively occluded the 3D elements drawn behind it. It became very easy to discard the rendering of these occluded fragments.
However, I was far away from being done…

When I hooked the Unity UI Profiler, one thing caught my attention.
I saw an overwhelmed CPU taking over 1 ms per frame on UI rendering. That’s a hell lot of time for a platform that gives you a budget of 13 ms for the whole game execution: physics, logic, 3D rendering, input, VR, networking are all in the same bucket.
And I’ve seen cases where UI kills CPU performance even more.
And that is the thing: UI can be optimized to be GPU-friendly, but that doesn’t directly translate into being CPU-performing.
In fact, CPU and GPU have very different tasks to accomplish in Unity UI Rendering. No wonder, I suggest you approach CPU and GPU optimization very differently, as seen in my previous blog post about Unity UI Optimization.
Doing more of Unity UI Profiling showed me the obvious problem: the UI was constantly being re-created every single frame, i.e. there was a Canvas Rebuild happening every frame.
A constant hit of 1 ms on the CPU… ouch.
But why would Unity do this to me?I thought Unity cached the UI Canvases…

Actually yes, that is correct. Unity effectively caches the canvases to make sure they are built just once.
The problem arises, though, when you change the properties of any of the UI elements of the canvas, such as a color, a position and so on.
That means, all animations we love, such as button hover effects, are killing your performance and you might not know it.
When UI property changes happen, Unity does the famous Canvas Rebuild that will crush your game’s performance.
A Unity UI Canvas Rebuild makes Unity iterate over all UI elements of that Canvas to generate an optimized list of draw calls (a set of vertices, colors, materials, etc.).. And Canvas Rebuilds take longer than a Seat Panda doing a 0-60 mph test.
That said, once you’ve acknowledged you suffered from constant UI Canvas Rebuilds, the natural question to make is…
Why am I suffering the Canvas Rebuilds and what can I do about them?
Answering that innocent question led me to spending 5+ hours researching this topic and empowering the Unity UI Profiler.
Let’s see how.
1. Unity UI Profiling: All Good, until…
Let’s say we have a weirdo of a UI in front of us.
That UI is barely doing anything but sitting there, being annoying to the player who just want to see something through it.
As a collection of 350+ images using a Grid Layout Group, it (miserably) looks like this:
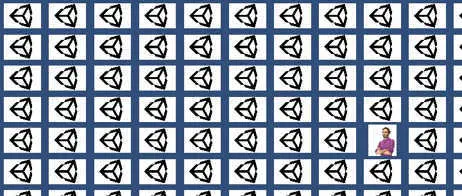
And that’s fine, even if it contains 350+ images. They will normally be rendered in just two draw calls, as there are two unique images that are not atlased in a sprite atlas.
Effectively, I can see in the profiler there’s almost no overhead on the CPU side. Most of the time we’re under 0.01ms, which is pretty damn good.
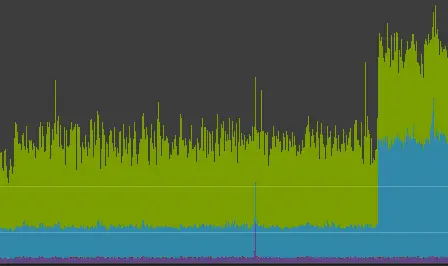
(…Most of the time)
Wait, what was that CPU spike at the end of the graph?
2. Unity UI Profiling: A wild Canvas Rebuild appears!
What has just happened there at the end of the Unity Profile? The Unity UI CPU cost has more than doubled in just a second, how weird.
I want to play a game
Find the two differences in the samples below (you may want to click on them for zooming in).


I’ll give you five seconds to find it out.
5, 4… Ok here’s a hint to make it easier:

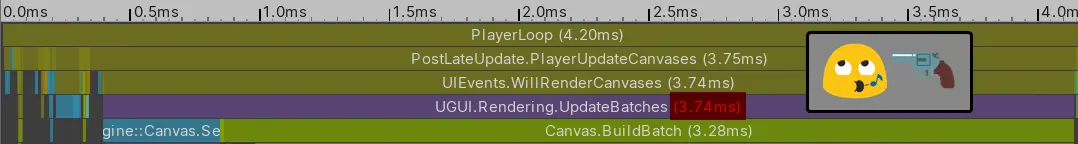
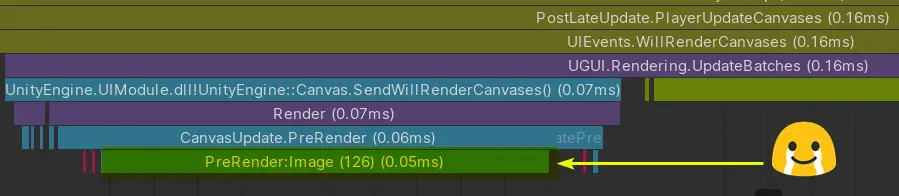
Yikes!
PostLateUpdate.UpdateRectTransform and UGUI.Rendering.UpdateBatches really wanted to take all the highlight in today’s show.
What do these regions do?
The first, UpdateRectTransform, implies that a transform of a specific object has changed, and therefore Unity has to run some expensive logic to keep visuals coherent. We don’t know whether it was a position, a rotation, a scale or any other of the RectTransform properties.
Heck, we don’t even know if it was just one attribute or all of them. Was it one object, or multiple? In any case, which ones? This is the problem: we do not know.
The second cost, UpdateBatches, relates to the fact that the whole Canvas geometry has to be rebuilt. This process is famously known as a Canvas Rebuild. A canvas rebuild implies that Unity goes through all the Canvas hierarchy to generate a list of draw calls, so to speak. The vertices, indices, colors, uv’s of all elements are computed and then a batching pass is done to we merge as many draw calls as possible to reduce the CPU overhead of issuing them to the graphics driver.
Now we know what’s going on, kind of. We’re on the right track. But how do we go about avoiding these canvas rebuilds? What is causing them?
We just need to find out more specific information…
- An attribute change in a UI element will mark the element itself as dirty.
- A UI element can be totally dirty, but can also be partially dirty: vertices-dirty, layout-dirty, material-dirty. Partial dirty states are cheaper to recover from.
- Unity will rebuild canvases entirely, as soon as any of its elements are marked as dirty.
- Canvas rebuilds are expensive on the CPU, avoiding them is the key.

3. Finding the Saboteur: a politically incorrect brute-force approach
We are still to give an answer to the following question:
Who’s triggering that sucky Unity UI Canvas Rebuild?
It turns out, there’s no fast way of finding that out, especially if your canvas hierarchy is immense.
But, to start out, I’ll show you the brute force approach for finding the source of UI Canvas Rebuilds.
1. Keep the Unity UI Profiler recording
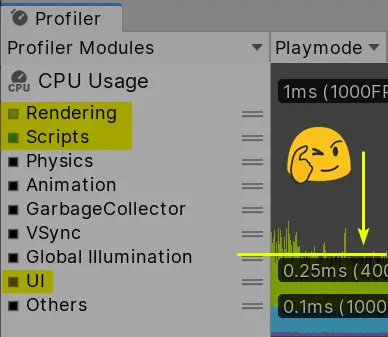
Filter the metrics so you can focus on what is important: Rendering, Scripts and UI.
Keep an eye on the baseline to have a visual cue of your current baseline cost, which should include the expensive Canvas Rebuilds.
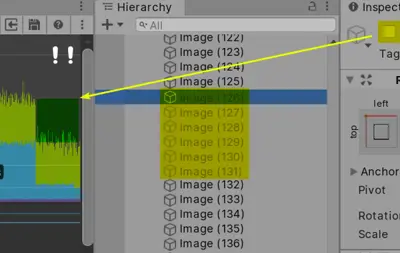
2. Deactivate UI Game Objects and compare
Select a group of game objects and deactivate it.
Compare the performance baseline. If the baseline didn’t improve much, continue deactivating game objects till you see a significant improvement.
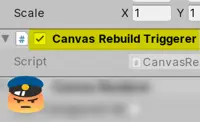
3. Find out who is modifying its properties
Now you managed to isolate which object is triggering your Canvas Rebuilds. But, who’s actually causing those?
Is it a script scaling it? Or maybe an animation changing its position?
It helps to do a right-click on the RectTransform and press “Find References in Scene“
Once you know who’s causing the UI canvas rebuilds, do something about it, such as disabling animations or transforms.
Ruben, how am I supposed to follow this approach in a huge UI hierarchy? Don’t give me crap
I told you it was going to be neither fast nor fun, but your players asked for it.
That’s the thing. Having a huge hierarchy in place is not ideal in the first place. Exactly those massive, deep hierarchies will make your Canvas Rebuilds incredibly expensive on the CPU.
But big and nested UI hierarchies can (and will) happen, so expect canvas rebuilds to hit you where it hurts the most: your players’ game-play experience.
While the brute force approach helps finding the source of canvas rebuilds, this does not scale in the long-run.
Becoming more professional about optimizing UI is what got me into creating a tool that would give me all the answers I needed to match my players’ expectations…
As we saw, there is a slow brute-force approach for finding the source of a canvas rebuild. Then, hopefully you’ll be able to do something about it, based on the strategies I posted on my Unity UI Optimization post (visit it, it’s free, I promise!).
But such as error-prone approach is a process a real guru would never settle for. You can literally spend days trying to avoid canvas rebuilds, but the moment you expect it the least, they’ll come back just to disappear as soon as you attach the Unity UI Profiler.
This becomes crucial if you’re doing VR development. You don’t want canvas rebuilds in your world-space UI. Like not at all. If you don’t get rid of these, you’re very much likely to convert your players into patients.
I get it, I will get rid of the canvas rebuilds. But the Unity Profiler won’t tell me much about those! What advice can you give me?

I’m glad you asked. It turns out we can convince the Unity Profiler to give us useful information about who’s messing with the performance of our UI.
You and I can augment the functionality of the Unity UI Profiler. We do so by altering the Unity UI source code that is publicly available. Once you have the source code, you’ll want to find the code functions where the Canvas Rebuilds take place. Then, all we need is some BeginSample and EndSample Profiler API love magic.
If you’re running Unity 2019.1 or earlier, the Unity UI source code is available for free in their Bitbucket repository. You can follow their guide there to download, install and modify it.
My suggestion? Use a newer Unity version, at least 2019.2.0. New versions of Unity include the UI source code by default, as the UI system is now part of the package manager. That’s the hassle-free way of doing this.
Here’s a list of code regions I found during my investigations where you could add the Profiling API calls:
- CanvasUpdateRegistry.cs: function PerformUpdate
- Graphic.cs: function SetAllDirty
- Graphic.cs: other functions such as SetVerticesDirty, SetMaterialDirty, etc..
<p><img src="https://new.thegamedev.guru/content/images/2026/02/Unity-UI-Profiling-Canvas-Rebuilds-Source-Code-1.webp" alt="" loading="lazy"/></p>
Useful? Yes.
Artist/Designer-friendly? Nope.
That’s why I wrote a small open-source Unity Extension to enhance the Unity Profiler for you.
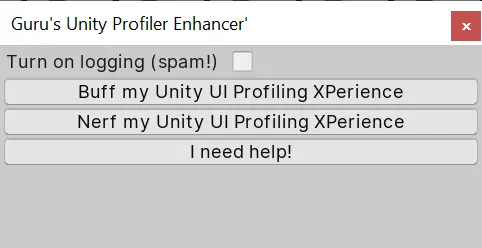
The free tool will allow you to quickly switch over profiling modes to make sure the performance of your game is on top.
The best part of the Unity Profiler enhancer? It just works outside of the editor, effectively replacing all the aspirins you’ve been taking while profiling your UI in Android and other platforms.
Here it is, all its power under your control with two simple buttons:
- Buff my Unity Profiler
- Nerf my Unity Profiler.
Free resource download
Sign up to unlock this resource and related performance materials.